2024: Comparing Conventional-Till Versus No-Till in NE North Dakota
(Research Report, Langdon REC, December 2024)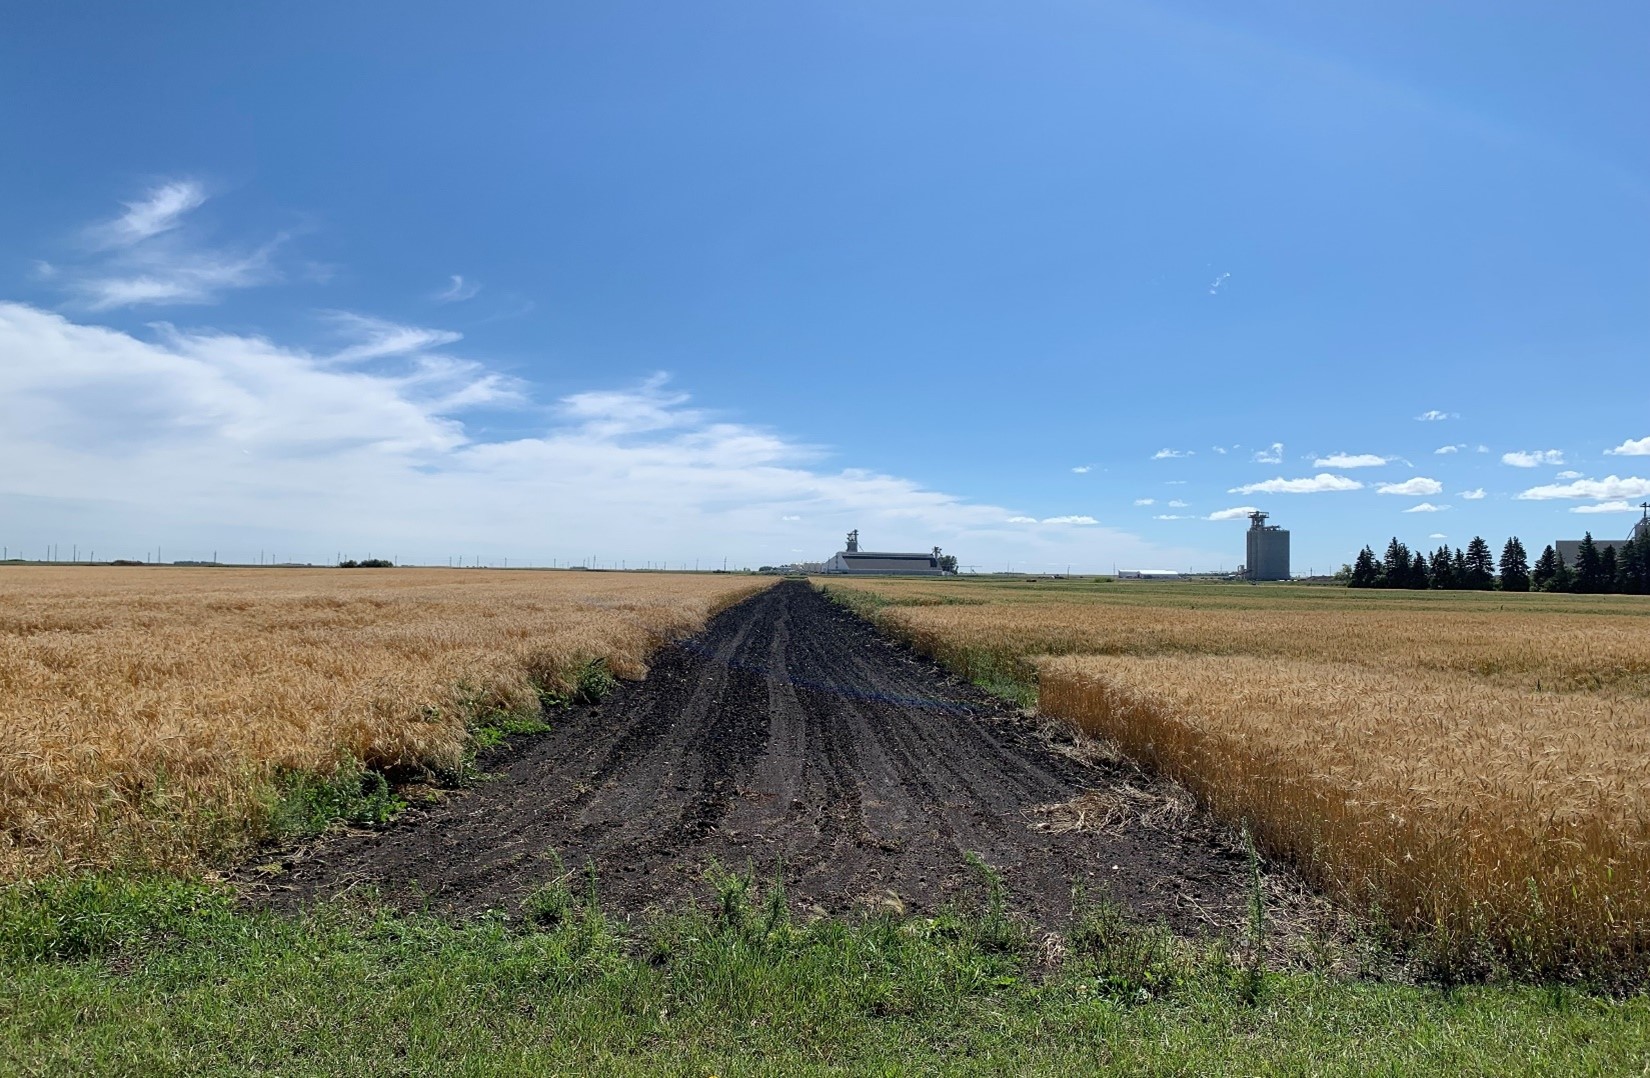
Figure 1. The Langdon Research Extension Center conventional-till versus no-till demonstration sites on August 29, 2024.
Conventional tillage practices and resulting topsoil disturbance and losses are well-documented. Early adopters of no-till in western North Dakota stopped performing tillage for planting several decades ago. Their main reasons were to conserve soil moisture, protect topsoil and build soil structure. However, in the northeast, producers mostly kept tilling their soils in fall and then again in spring. The common reason was, and still is, to dry the top four to six-inches of soil for planting early as northeast ND has a slightly shorter growing-season compared to the other parts of the state. As per the North Dakota Agricultural Weather Network (NDAWN), the Langdon area has the lowest accumulated growing degree days for growing canola, wheat, sunflower and soybean compared to the Carrington, Dickinson, Fargo, Hettinger, Minot and Williston stations.
The recent wet weather cycle, beginning in 1993, made switching to no-till difficult as producers became leery about wet field conditions in the spring resulting in late planting. A shorter growing season resulting in late planting can not only cause significant yield losses but there could be difficulties during harvest due to a wet fall or early frost. Depending upon the soil type, landscape and agronomic practices, it can take several years for the no-till practices to improve soil structure and water infiltration to help overcome challenges posed by a wet spring or fall. Several producers in the NE in the past have tried no-till. However, due to the wet weather, they faced numerous challenges such as muddy and saturated fields, cooler soil temperatures, poor seedbed, late planting, soil crusting, poor germination and stands during spring and muddy and sometimes snowy fields during fall harvest. Most of them gave up no-till after one or two years and went back to conventional-till thus making the transitioning to no-till for future optimists more challenging.
Objectives
Short-term objectives of this study were and are to determine how early each field can be planted and record differences in input costs, germination, stands, yields, profits and losses. Long-term objectives include recording effects on soil health such as soil salinity, sodicity, pH, structure, pore space and water infiltration (movement through soil layers).
Site Details
An approximately 35-acre field was divided to create a conventional-till and a no-till site into rectangular shapes from north to south. The no-till field measures approximately 13.7 acres and the conventional-till side measures around 20.6 acres with a 15-foot border between the two fields. Both sites include productive, marginal and unproductive areas in order to be truly representative of farmer fields.
Field Work Details
This report provides a summary of all of the work that has been done to the conventional-till and no-till sites since the inception of this demonstration in fall-2021 in order to provide a complete picture to the readers.
Conventional-till
Fall-2021
- After harvesting soybeans, site was chiseled once on October 6.
Spring and Summer of 2022
- A uniform rate of 125 pounds of N per acre of urea was spread on May 29 followed by one-pass of the cultivator for incorporation.
- Fargo and Treflan (PPI) were sprayed on June 6 followed by two-passes of a cultivator.
- On June 7, Prosper (HRSW) was planted at the seeding rate of 1.7 bushels per acre using a Concord 40-foot wide air seeder.
Fall-2022
- Site was swathed on September 19 and combined on September 28.
- Site was disked once on October 5.
Spring and Summer of 2023
- Site was cultivated and harrowed once followed by planting ND21008GT20 (soybean) at the seeding rate of 60 pounds/acre (174960 seeds/acre) on May 26, 2023.
- On June 16, Roundup PowerMax 3 at 30 ounces/acre + Kicker at 2.5 gallons/100 gallons of water was sprayed at the rate of 10 gallons/acre.
- On July 10, Roundup PowerMax 3 at 30 ounces/acre + Kicker at 2.5 gallons/100 gallons of water was sprayed at the rate of 10 gallons/acre.
Fall-2023
- Site was straight combined on October 12.
- Site was chiseled twice on October 18 and 19.
Spring and Summer of 2024
- Site was cultivated once on April 25.
- Eighty pounds of nitrogen and 60 pounds of P2O5 through monoammonium phosphate (MAP) and urea was applied, followed by one-pass of the cultivator for incorporation on May 18.
- Site was planted with foundation grade Faller HRSW with air seeder at the rate of 100 pounds of wheat per acre on May 19.
- A herbicide mix of Everest 3.0, Husky FX, Starane Ultra and Cue (a basic blend such as Linkage, Quad 7 or Ascension) was sprayed on June 26.
- Prosaro Pro 400 SC was sprayed on July 16.
Fall-2024
- Site was straight combined September 26.
- Site was cultivated once October 1.
- Site was cultivated again on October 3.
No-till
Spring and Summer of 2022
- No-till site was planted with Prosper (HRSW) on June 13 using a John Deere 1895 disk no-till drill. Seeding rate was 1.7 bushels per acre. Due to an issue of the no-till drill not able to flow high fertilizer rates, only 62.5 pounds per acre of N (136 pounds of urea per acre) was applied at the time of planting. The rest of the 62.5 pounds of N per acre was top dressed later in order to make the no-till fertilizer rate comparable to the conventional-till site.
- No-till site was sprayed with Roundup PowerMax 3 at 20 ounces/acre with Kicker (active ingredient ammonium sulfate) at 2.5 gallons per 100 gallons of water (0.27 gallons of Kicker per acre).
Fall-2022
- Site was swathed on September 19 and combined on September 28.
Spring and Summer of 2023
- No-till side was planted on May 30, 2023 with ND21008GT20 (soybeans) at the seeding rate of 60 pounds/acre (174960 seeds/acre).
Note: Both conventional-till and no-till fields appeared ready for planting on the same day. However, conventional-till field was planted on May 26, 2023, whereas, no-till was planted on May 30, 2023. The delay in planting was due to equipment issues.
- On May 31, Roundup PowerMax 3 at 20 ounces/acre mixed with 0.5 gallons of Flame per 100 gallons of water was applied at the rate of 10 gallons/acre.
- On June 13, Roundup PowerMax 3 at 29 ounces/acre mixed with 16 ounces of Varisto + 24 ounces of Invade CNL + 24 ounces of Kicker/acre mixed in 100 gallons of water was applied at the rate of 10 gallons/acre.
- On June 30, Flexstar at 13 ounces + MSO at 35 ounces + Avatar at 6.6 ounces and Kicker at 70 ounces/acre was applied at 20 gallons/acre.
Fall-2023
- About 70% (10 acres out of 14) of the no-till site was straight combined on October 13. The remaining 30% (4 acres) could not be harvested due to very high weed pressure (mainly kochia, green foxtail and volunteer spring wheat).
- Remaining 30% of the no-till site was cleaned up using a combine in order to evenly spread the residue for spring-2024.
On October 22, Roundup PowerMax 3 at 30 ounces/acre with 2,4-D at 19 ounces/acre and Kicker at 64 ounces/acre was sprayed at 10 gallons/acre.
Spring and Summer of 2024
- Site was sprayed with a mix of Paraquat 3SL, Roundup PowerMax3, Ammonium Sulfate and Vincitro (Non-ionic surfactant) pre-emergence herbicide on May 15.
- A total of 15 pounds of P2O5 with 100 pounds of nitrogen was banded on May 23. Since the total fertilizer quantity would have been more than what the no-till drill could flow through, half of the fertilizer was banded with one-pass of the no-till drill and the remaining half of the fertilizer was banded at the time of planting foundation grade Faller HRSW at the rate of 100 pounds per acre on the same day (May 23).
- A mix of Everest 3.0 + Husky FX + Starane Ultra + Cue (a basic blend such as Linkage, Quad 7 or Ascension) was sprayed on June 21.
Fall-2024
- Site was swathed on September 5 and combined on September 26.
- A mix of Roundup PowerMax, Havok LV6, Valor SX and Kicker (AMS) herbicides was sprayed on October 16.
Soil Sampling and Analysis
In fall 2021-2023, the following type of soil sampling and analysis was performed.
- Separate composite four-foot deep soil samples for 0-12”, 12-24”, 24-36” and 36-48” depths were taken from the conventional-till productive ground (CT-PG), conventional-till unproductive ground (CT-UG), no-till productive ground (NT-PG) and no-till unproductive ground (NT-UG). Fall-2021 soil samples were analyzed for textural and chemical analysis, whereas, fall-2022-2023 samples were analyzed for chemical analysis only.
- Separate soil bulk density samples were taken from CT-PG, CT-UG, NT-PG and NT-UG for 0-5” and 5-10” depths in fall 2021-2023.
Soil Chemical Analysis Results
Based on the 2021-2023 soil EC (for salinity) and SAR (for sodicity) results, the conventional-till productive ground had no salinity to low levels of salinity and no issue of sodicity in the 0-12 inch depth. The conventional-till unproductive ground had low to high levels of salinity with moderate levels of sodicity in the 0-12-inch soil depth. The no-till productive ground had low to moderately high levels of salinity and low levels of sodicity in the 0-12-inch depth. The no-till unproductive ground had high to very high levels of salinity and high levels of sodicity in the 0-12-inch soil depth. Details are in Table 1.
Table 1. The 2021-2023 soil EC and SAR results of the conventional-till and no-till productive and unproductive sites for the 0-12, 12-24, 24-36 and 36-48-inch depths.
Site | Depth (inches) | 2021 | 2022 | 2023 | 2021 | 2022 | 2023 |
|---|---|---|---|---|---|---|---|
|
| EC (dS/M) | SAR | ||||
Conventional-till PG | 0-12 | 2.44 | 0.95 | 0.86 | 2.06 | 1.46 | 1.35 |
12-24 | 4.90 | 0.67 | 2.23 | 3.99 | 3.58 | 1.53 | |
24-36 | 5.25 | 1.08 | 1.95 | 5.89 | 4.19 | 2.43 | |
36-48 | 2.09 | 1.17 | 1.44 | 7.67 | 5.53 | 4.58 | |
Conventional-till UG | 0-12 | 10.43 | 14.11 | 4.81 | 10.88 | 18.78 | 14.41 |
12-24 | 11.28 | 12.12 | 5.11 | 11.27 | 17.15 | 14.05 | |
24-36 | 10.39 | 8.05 | 4.16 | 11.36 | 16.05 | 11.11 | |
36-48 | 8.47 | 6.42 | 2.84 | 10.19 | 11.13 | 10.80 | |
No-till PG | 0-12 | 4.18 | 3.06 | 2.54 | 4.45 | 5.09 | 6.58 |
12-24 | 7.10 | 7.31 | 3.84 | 10.74 | 13.94 | 12.88 | |
24-36 | 8.16 | 9.69 | 2.91 | 18.11 | 21.80 | 18.48 | |
36-48 | 8.19 | 9.01 | 3.07 | 17.47 | 19.32 | 19.14 | |
No-till UG | 0-12 | 13.52 | 17.83 | 8.57 | 24.15 | 24.21 | 23.01 |
12-24 | 13.34 | 12.84 | 5.98 | 23.02 | 17.64 | 16.67 | |
24-36 | 11.82 | 11.45 | 5.43 | 23.50 | 15.96 | 16.69 | |
36-48 | 10.86 | 9.61 | 3.85 | 18.14 | 17.19 | 15.50 | |
Soil Bulk Density Analysis Results
Soil bulk density levels remained more or less the same in 2021-2023 and changed slightly depending upon the gravimetric soil water content. High soil water content resulted in slightly lower bulk density. The main difference was in 2021 0-5-inch soil depth had higher bulk density than the 5-10-inch depth. However, in 2022-2023, 0-5-inch bulk density mostly had lower bulk density than the 5-10-inch depth. These trends were consistent in both conventional-till and no-till sites. Details are in Table 2.
Table 2. The 2021-2023 soil bulk density results of the conventional-till and no-till productive and unproductive sites for the 0-5, 5-10-inch depths.
Site | Depth | 2021 | 2022 | 2023 |
|---|---|---|---|---|
| (inches) |
|
|
|
| Soil Bulk Density (grams/cm3) | |||
Conventional-till PG | 0-5” | 1.36 | 1.34 | 1.23 |
5-10” | 1.26 | 1.44 | 1.39 | |
Conventional-till UG | 0-5” | 1.45 | 1.36 | 1.17 |
5-10” | 1.22 | 1.37 | 1.27 | |
No-till PG | 0-5” | 1.44 | 1.32 | 1.35 |
5-10” | 1.25 | 1.36 | 1.35 | |
No-till UG | 0-5” | 1.50 | 1.36 | 1.33 |
5-10” | 1.34 | 1.47 | 1.34 | |
Measurement of Soil Water Infiltration
Soil water infiltration rates were measured by pounding a six-inch diameter ring into the surface soil. Once the ring was in place, 444 ml of deionized water was used to simulate one inch of rain. Once there was no standing water, while soil was still saturated, a second inch of rain was simulated by pouring 444 ml of additional deionized water. Both simulations were timed for water absorption into the soil. Annual infiltration rates are in Table 3. There have been a few key observations regarding soil water infiltration rates:
- In 2021-2022, soil water infiltration rates of conventional-till productive and unproductive grounds (despite moderately high sodicity in the 0-12 inch depth) were much faster than the no-till productive and unproductive grounds.
- On the no-till site, water infiltration was much faster on productive ground versus unproductive ground. That was mainly an effect of higher sodicity level that causes soil dispersion resulting in dense soil layers.
- In 2023 and 2024, the no-till unproductive ground infiltration rates were much slower compared to 2021-2022.
Table 3. The 2021-2024 soil water infiltration rates of the conventional-till and no-till productive and unproductive sites.
2021 | ||
|---|---|---|
Site | Time for infiltrating First-inch | Time for infiltrating Second-inch |
Conventionally-Tilled Productive Ground (CT-PG) | 53.18 seconds | 3 minutes and 3.29 seconds |
Conventionally-Tilled Un-productive Ground (CT-UG) | 36.45 seconds | 3 minutes and 33.87 seconds |
No-Tilled Productive Ground (NT-PG) | 2 minutes and 5.74 seconds | 8 minutes and 21.19 seconds |
No-Tilled Un-productive Ground (NT-UG) | 23 minutes and 1.88 seconds | 1 hour, 16 minutes and 20.97 seconds |
2022 | ||
Site | Time for infiltrating First-inch | Time for infiltrating Second-inch |
Conventionally-Tilled Productive Ground (CT-PG) | 1 minute and 17.83 seconds | 5 minutes and 58.50 seconds |
Conventionally-Tilled Un-productive Ground (CT-UG) | 3 minutes and 0.16 seconds | 12 minutes and 40.98 seconds |
No-Tilled Productive Ground (NT-PG) | 2 minutes and 57.55 seconds | 5 minutes and 35.16 seconds |
No-Tilled Un-productive Ground (NT-UG) | 26 minutes and 54.37 seconds | 1 hour, 20 minutes and 41.87 seconds |
2023 | ||
Site | Time for infiltrating First-inch | Time for infiltrating Second-inch |
Conventionally-Tilled Productive Ground (CT-PG) | 30.82 seconds | 4 minutes and 50.60 seconds |
Conventionally-Tilled Un-productive Ground (CT-UG) | 2 minutes and 08.37 seconds | 16 minutes and 59.58 seconds |
No-Tilled Productive Ground (NT-PG) | 1 minute and 30.03 seconds | 3 minutes and 38.96 seconds |
No-Tilled Un-productive Ground (NT-UG) Site-A | 4 hours, 41 minutes and 02.18 seconds | 18 hours and 58.05 seconds |
No-Tilled Un-productive Ground (NT-UG) Site-B | 1 hour, 20 minutes and 30.76 seconds | 5 hours, 20 minutes and 58.51 seconds |
2024 | ||
Site | Time for infiltrating First-inch | Time for infiltrating Second-inch |
Conventionally-Tilled Productive Ground (CT-PG) | 5 seconds | 36.08 seconds |
Conventionally-Tilled Un-productive Ground (CT-UG) | 6 minutes, 30.47 seconds | 30 minutes and 53.74 seconds |
No-Tilled Productive Ground (NT-PG) | 17 minutes and 33.93 seconds | 37 minutes and 36.86 seconds |
No-Tilled Un-productive Ground (NT-UG) | 8 hours, 12 minutes and 23.4 seconds | 46 hours, 41 minutes and 46 seconds |
Note:
- In fall-2023, one NT-UG Site (NT-UG Site-A) site was measured for soil water infiltration that had much slower water infiltration compared to 2021-2022. In order to verify the infiltration rates, another site was measured (NT-UG Site-B) that recorded infiltration rates that were still much higher than 2021-2022, however, slightly more rapid than the NT-UG Site A.
- The fall-2024 infiltration rates of NT-UG were very similar or even slower than the 2023 rates for the same site. 2024 measurement details are below:
- CT-PG, CT-UG and NT-PG sites were measured on October 21, 2024 at 11:21 a.m., 12:48 p.m. and 11:28 a.m.
- The NT-UG Site-A was started on October 21, 2024 at 1:33 p.m. It was abandoned around 6:09 p.m. as there was still water standing in the ring.
- NT-UG site B was measured on October 22, 2024 at 8:08 a.m. The 1st inch was not fully absorbed into the soil. Since it had been more than 8 hours, around 4:30 p.m. the second inch was started in the ring.
- It seemed that in the NT-UG site ring initially water moves into the soil, but then it just sits there with no infiltration at all.
- The NT-UG Infiltration Site-B never fully absorbed the 2nd inch even after 46 hours and 41 minutes. It was abandoned at 3:06 p.m. on October 24, 2024.
Growing-Season Observations
2022
The conventional-till side was planted six days earlier than the no-till side, but the no-till side had better germination and plant stands. This could be due to saturated soil a few inches below the soil surface on the conventional-till side and had slightly poorer germination in the tire tracks. Stands were thin and were still green at the time of swathing. Despite the late planting, the no-till side had improved germination due to no soil disturbance and uniform stands. That could also be due to the differences in seeding equipment; a Concord 40-foot wide air seeder was used on the conventional-till side, whereas, a John Deere 30-foot wide no-till drill was used on the no-till side. In addition, the no-till side was harvested at the same time and yielded three bushels per acre more than the conventional-till.
2023
No-till productive and unproductive sides had severe weed issues from the beginning of the growing-season, mainly with herbicide resistant kochia, volunteer wheat, green foxtail barley and horseweed, which continued until fall. In addition, the no-till side will have a much larger seed bank to cause weed issues in the 2024 growing-season compared to conventional-till. This was a result of southerly winds in fall-2022 that rolled over a lot of kochia plants to the no-till and conventional-till fields to an extent where some plants were stuck on the shelterbelt trees on the north side. The conventional till side was cultivated and harrowed in the spring eliminating most of the weeds while the no-till field was not and had a lot of kochia and foxtail. A PPI herbicide may have improved weed control. Pre-emergence herbicide application could have produced better results; however, it needed to be incorporated in the soil or timed with a good rain. Incorporation on no-till was not an option. Several pre-herbicides can be used on no-till soybeans but need rain for incorporation. Spring of 2023 was very dry and this would have probably resulted in ineffective weed control. The end result was severe kochia contamination in the no-till field despite three sprays versus two sprays on the conventional-till side where weed pressure was much lower.
2024
No-till had big areas where wheat germination was poor and slow due to heavy rains right after planting that left soil saturated, cooler and drowned out compared to conventional-till. Conventional-till had much better germination, growth and vigor except the drowned-out areas. No-till lost the competition right there in the beginning. In addition, no-till areas with poor or no-growth had high weed pressure versus where wheat germinated good and had good stand. Over all, weed pressure in the no-till was lower in 2024 versus 2023. In comparison, conventional-till had a better start versus no-till and it resulted in higher yields.
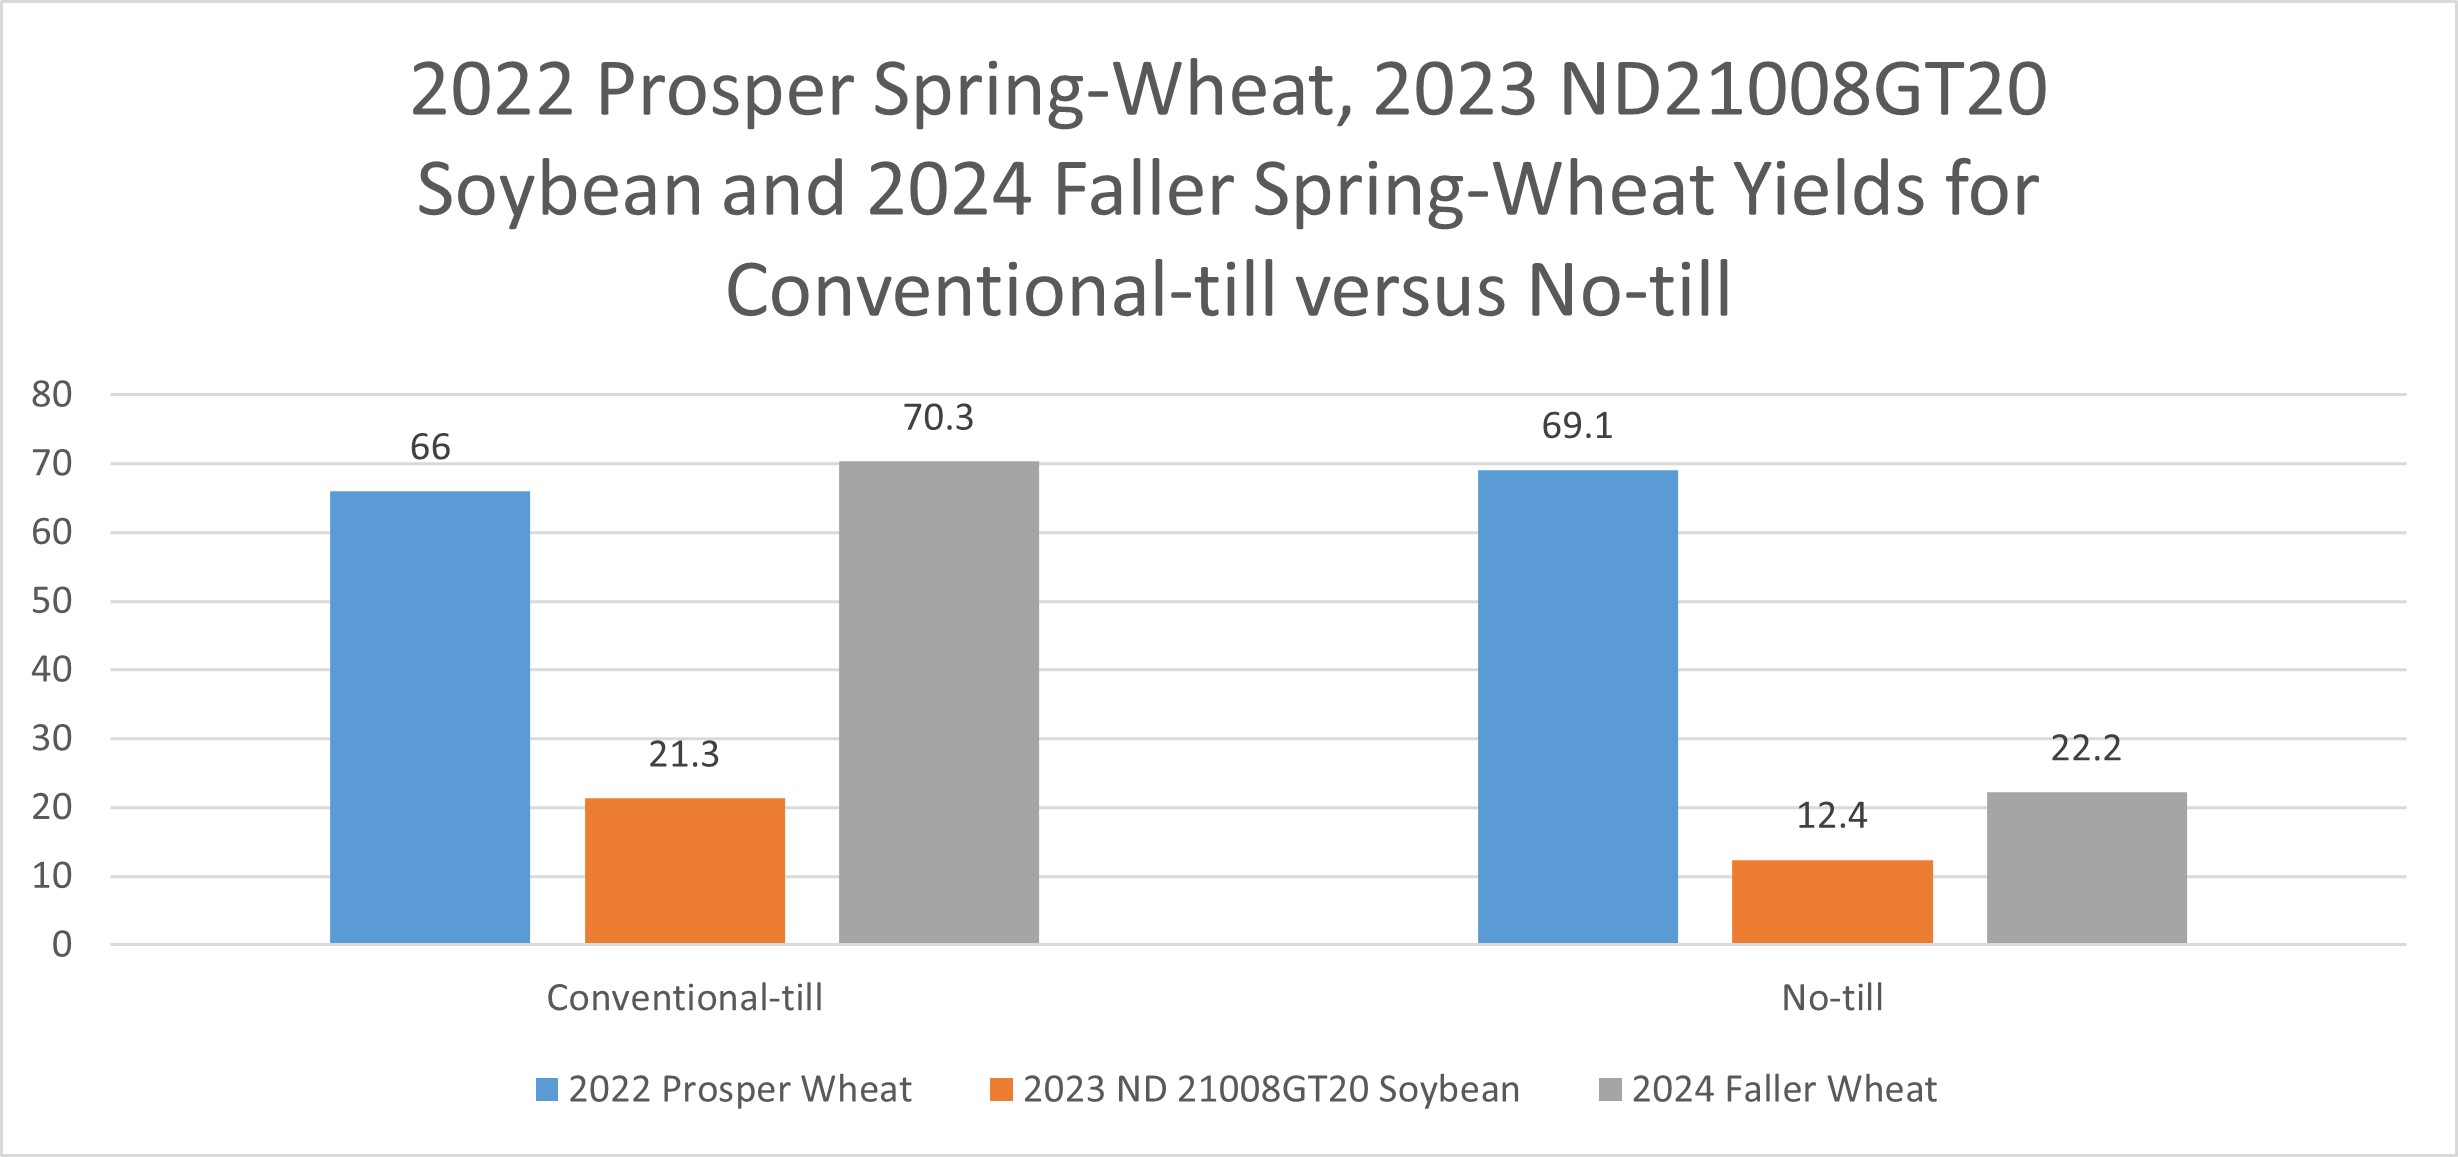
Yield Differences in 2021-2024
Like 2023, conventional-till yielded higher than the no-till in 2024. In 2023, lower no-till yield was due to high weed pressure compared to conventional-till. In 2024, weed pressure was lower in no-till compared to 2023, however, heavy rains right after planting resulting in saturated, cooler and drowned out areas leading to poor germination and stands in large areas of the no-till. Details are in Figure 2.
Figure 2. The Langdon Research Extension Center conventional-till versus no-till demonstration 2022-2024 yield comparisons.