2024: Determining the Economic Response of Sodic Soils to Remediation by Gypsum, Elemental Sulfur and Versalime in Northeast North Dakota on Tiled Fields
(Research Report, Langdon REC, December 2024)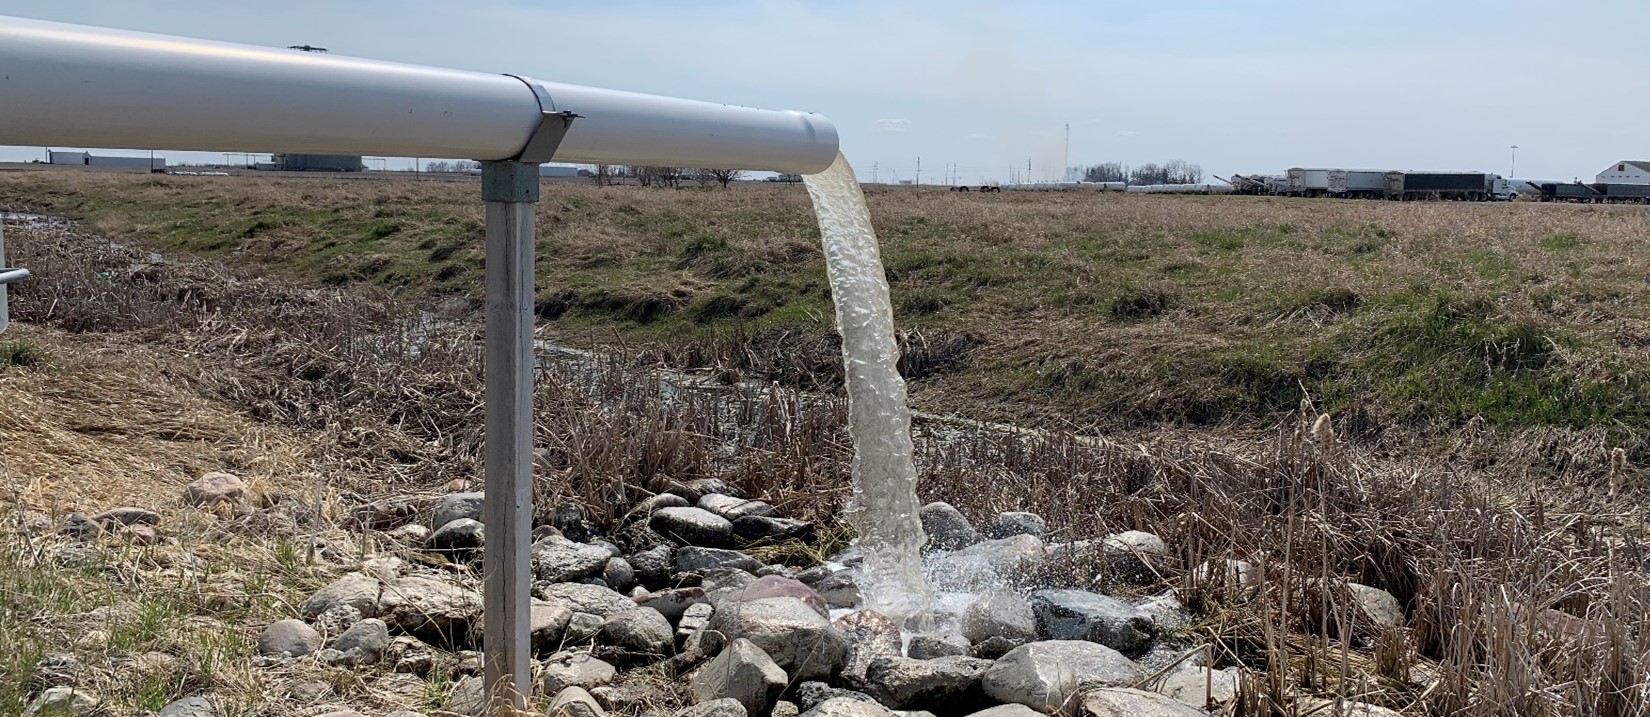
Figure 1. The NDSU Langdon Research Extension Center Groundwater Management Research Project Lift Station.
This research report is an extension of an ongoing long-term research trial on a tiled saline and sodic site. The main objectives of the trial have been:
- Does existing soil sodicity negatively affect tile drainage performance?
- Will tiling lower soil salinity under wet and dry weather conditions?
- Does the tile-drained water increase salinity and sodicity levels of the surface water resources?
This abbreviated report only summarizes annual soil electrical conductivity (EC), sodium adsorption ratio (SAR), pH, soil bulk density and tiled-drained water quality results. If information about the trial background, objectives, location, site description, design, methodology and complete set of data collected annually is needed, please contact the NDSU Langdon Research Extension Center:
Mail: 9280 107th Avenue NE, Langdon, ND 58249
Phone: (701) 256-2582
Email: ndsu.langdon.rec@ndsu.edu
RESULTS AND DISCUSSION
Considering the main objectives of the study, this report includes the statistical analysis of soil EC (salinity), SAR (sodicity), pH and soil bulk density (BD) and its corresponding gravimetric water content (GW in %). Differences in these properties are compared at the time of tiling in 2014 versus after applying the soil amendments (treatments) on tiled land in 2015 and onwards. The treatment means of EC, SAR and pH represent 2014 and 2016-2024 results of three replications for the zero to four-foot soil depths. The treatment means of soil bulk density represent 2015-2024 results of three replications for the zero to ten-inch soil depths. The water quality results of the tile-drained field were compared with the results of upstream and downstream water samples.
Annual Changes in Weather
Changes in the soil chemical, physical and biological properties are greatly influenced by the fluctuations in the weather such as annual evapotranspiration and rainfall and resulting groundwater depths and capillary rise of soil water. In this report focus is given to the effects of weather on the soil chemical and physical properties. The annual growing-season rainfall and potential evapotranspiration (Penman) data was collected from the NDAWN (North Dakota Agricultural Weather Network) Langdon station from May 1 to October 31. The average annual growing-season groundwater depths were calculated by averaging the actual weekly measurements for the same time period.
Figure 2. Annual average growing-season potential evapotranspiration (Penman), actual rainfall and normal rainfall in inches measured from May 1 to October 31 by the NDSU Langdon NDAWN (North Dakota Agricultural Weather Network) station.
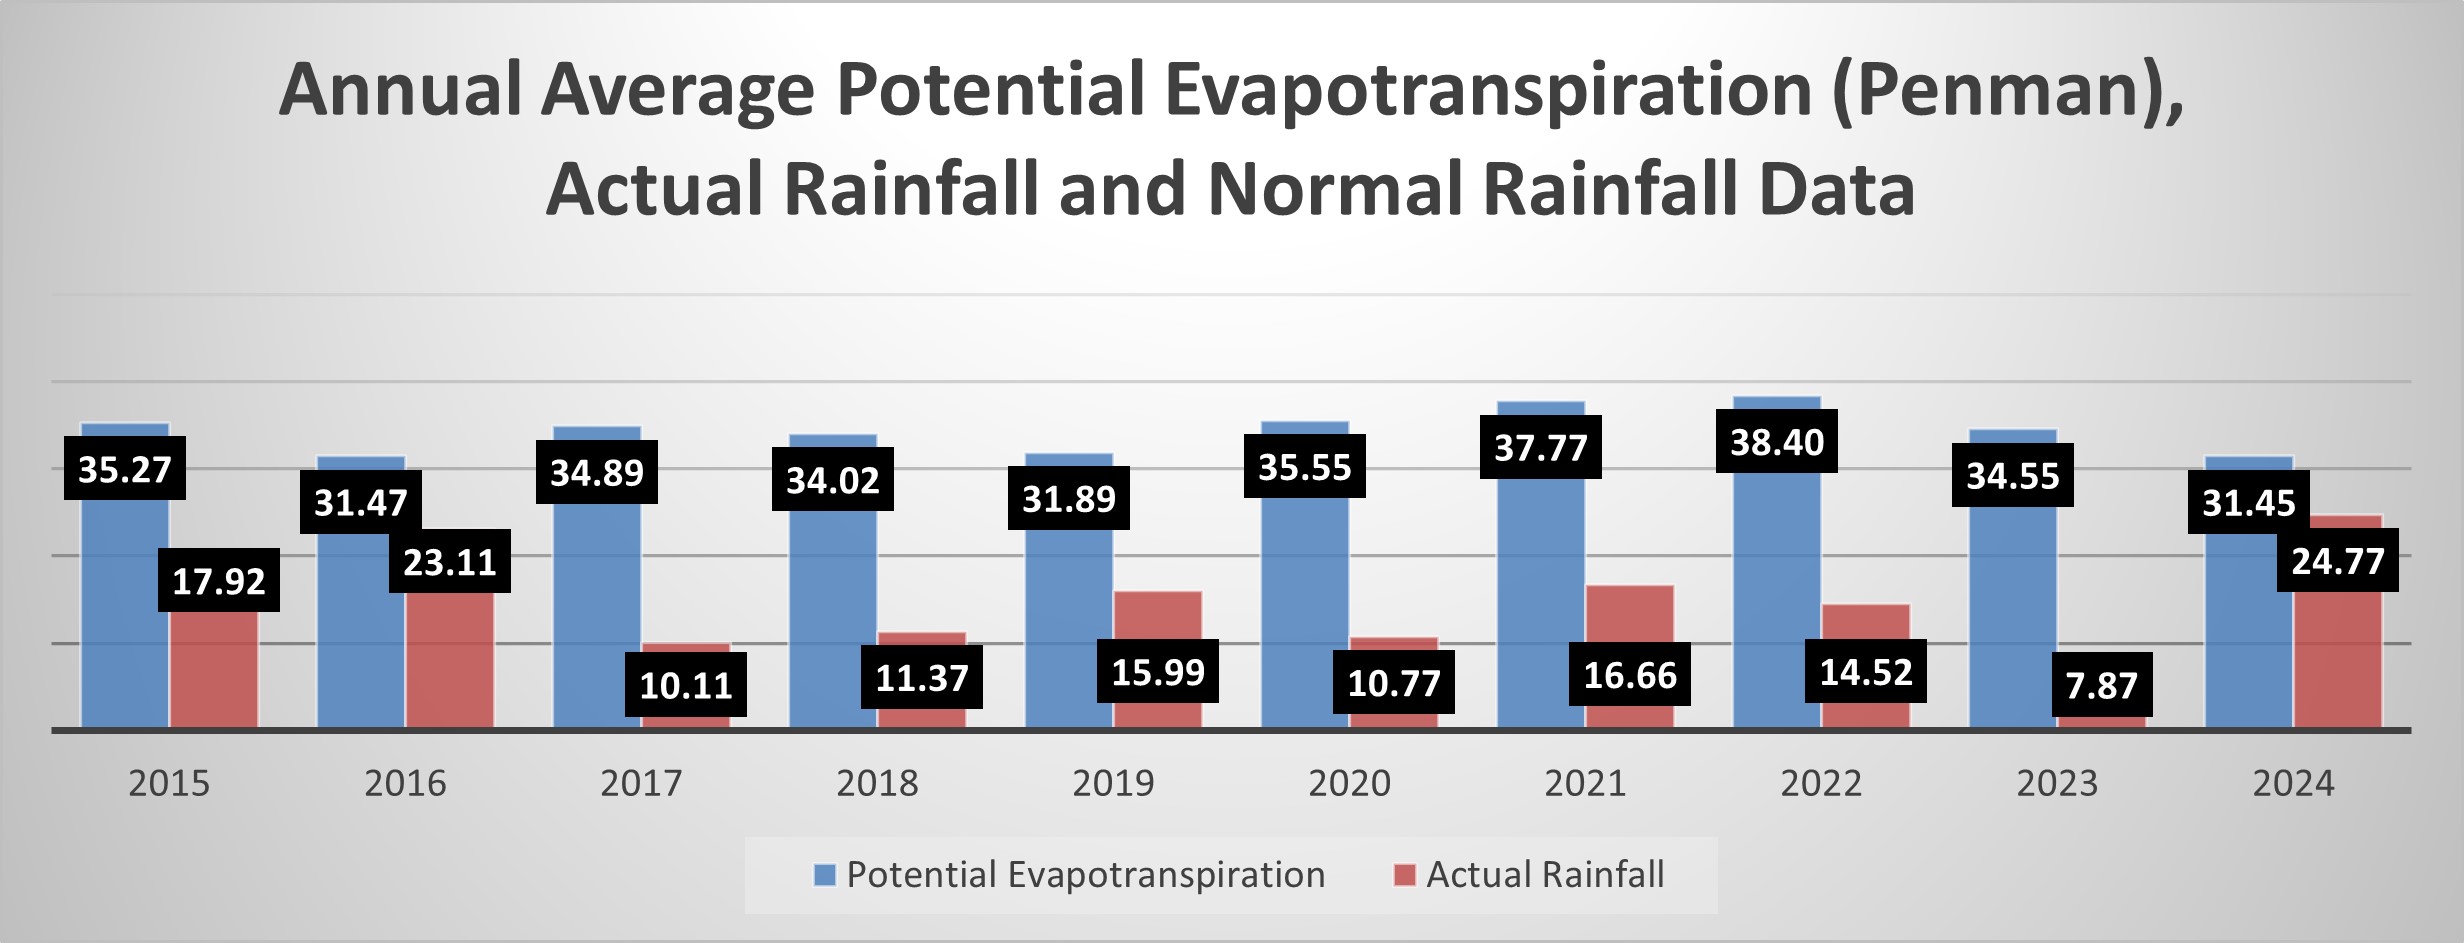
Note: The normal rainfall for 2015-2024 for May 1 to October 31 was 16.82-inches.
Increased evapotranspiration versus lower rainfall generally result in lower groundwater depths but less leaching of water-soluble salts, increased capillary rise of soil water (or groundwater) and slower breakdown of soil amendments. A smaller gap between these two (high rainfall combined with lower evapotranspiration) could result in shallower groundwater depths. However, under good soil water infiltration and improved drainage, not only excess salts can be moved (or leached) out of the fields but soil amendments can also produce favorable results. A smaller gap between evapotranspiration and rainfall will also result in reduced capillary rise of soil water (wicking up) as capillary water moves from higher to lower moisture levels.
Figure 3. Annual means of average growing-season groundwater depths for replications and treatments in feet measured from May 1 to October 31 on a weekly basis.
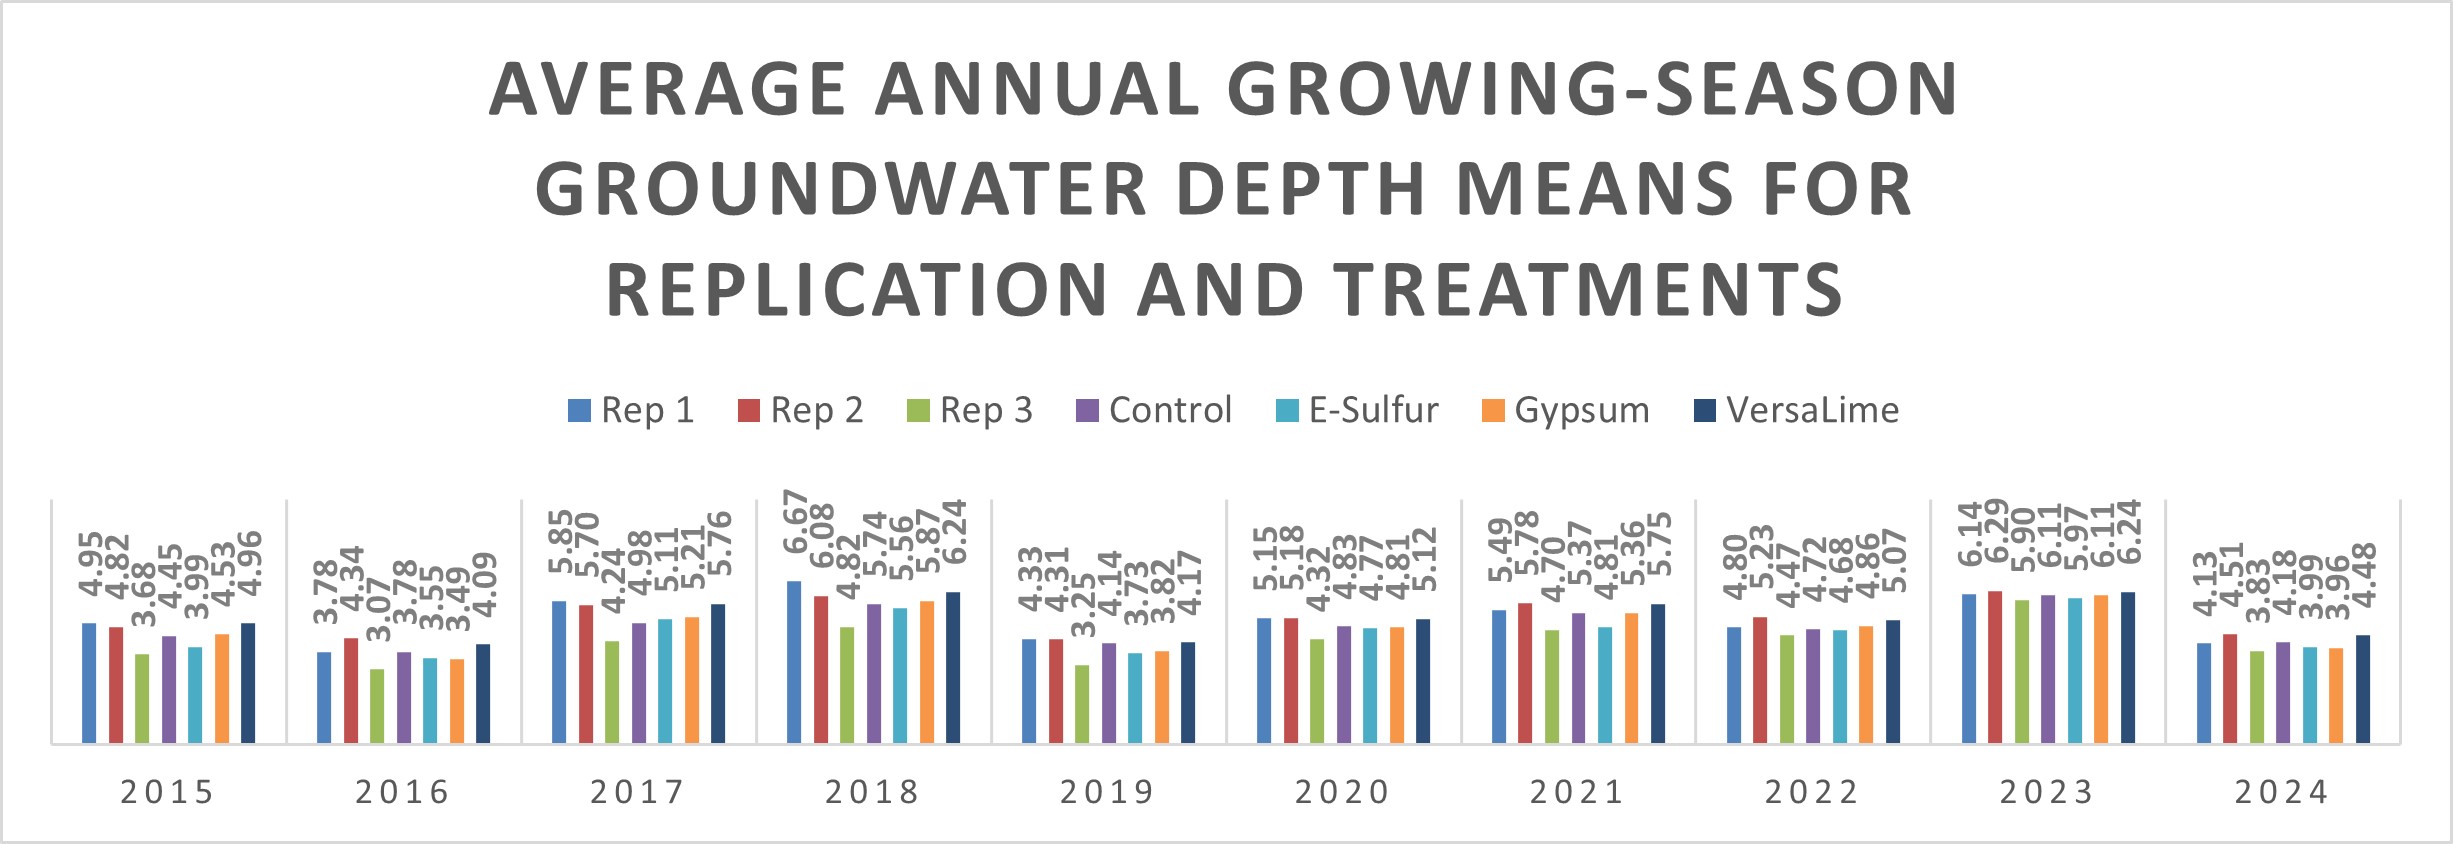
Note: In 2015, groundwater depths were only measured from mid-June to the end of October.
The average annual growing-season groundwater depths (also called water table levels) varied annually depending upon the rainfall. The shallowest groundwater depths were observed in 2016. The deepest groundwater depths were recorded in 2018 and 2023. It is important to note that weekly groundwater depths were measured randomly; sometimes right after a heavy rain and sometimes during dry periods. Those differences in the timings of recording the groundwater depths reflect on the averages and should be taken into consideration.
Differences in Soil EC (Salinity) Levels
Soil EC levels have been directly related to the annual growing-season rainfall and resulting moisture levels in the topsoil. Details of soil EC levels are shown in Figure 4.
Figure 4. Annual soil EC (dS/m) means for replications, treatments and soil depths.
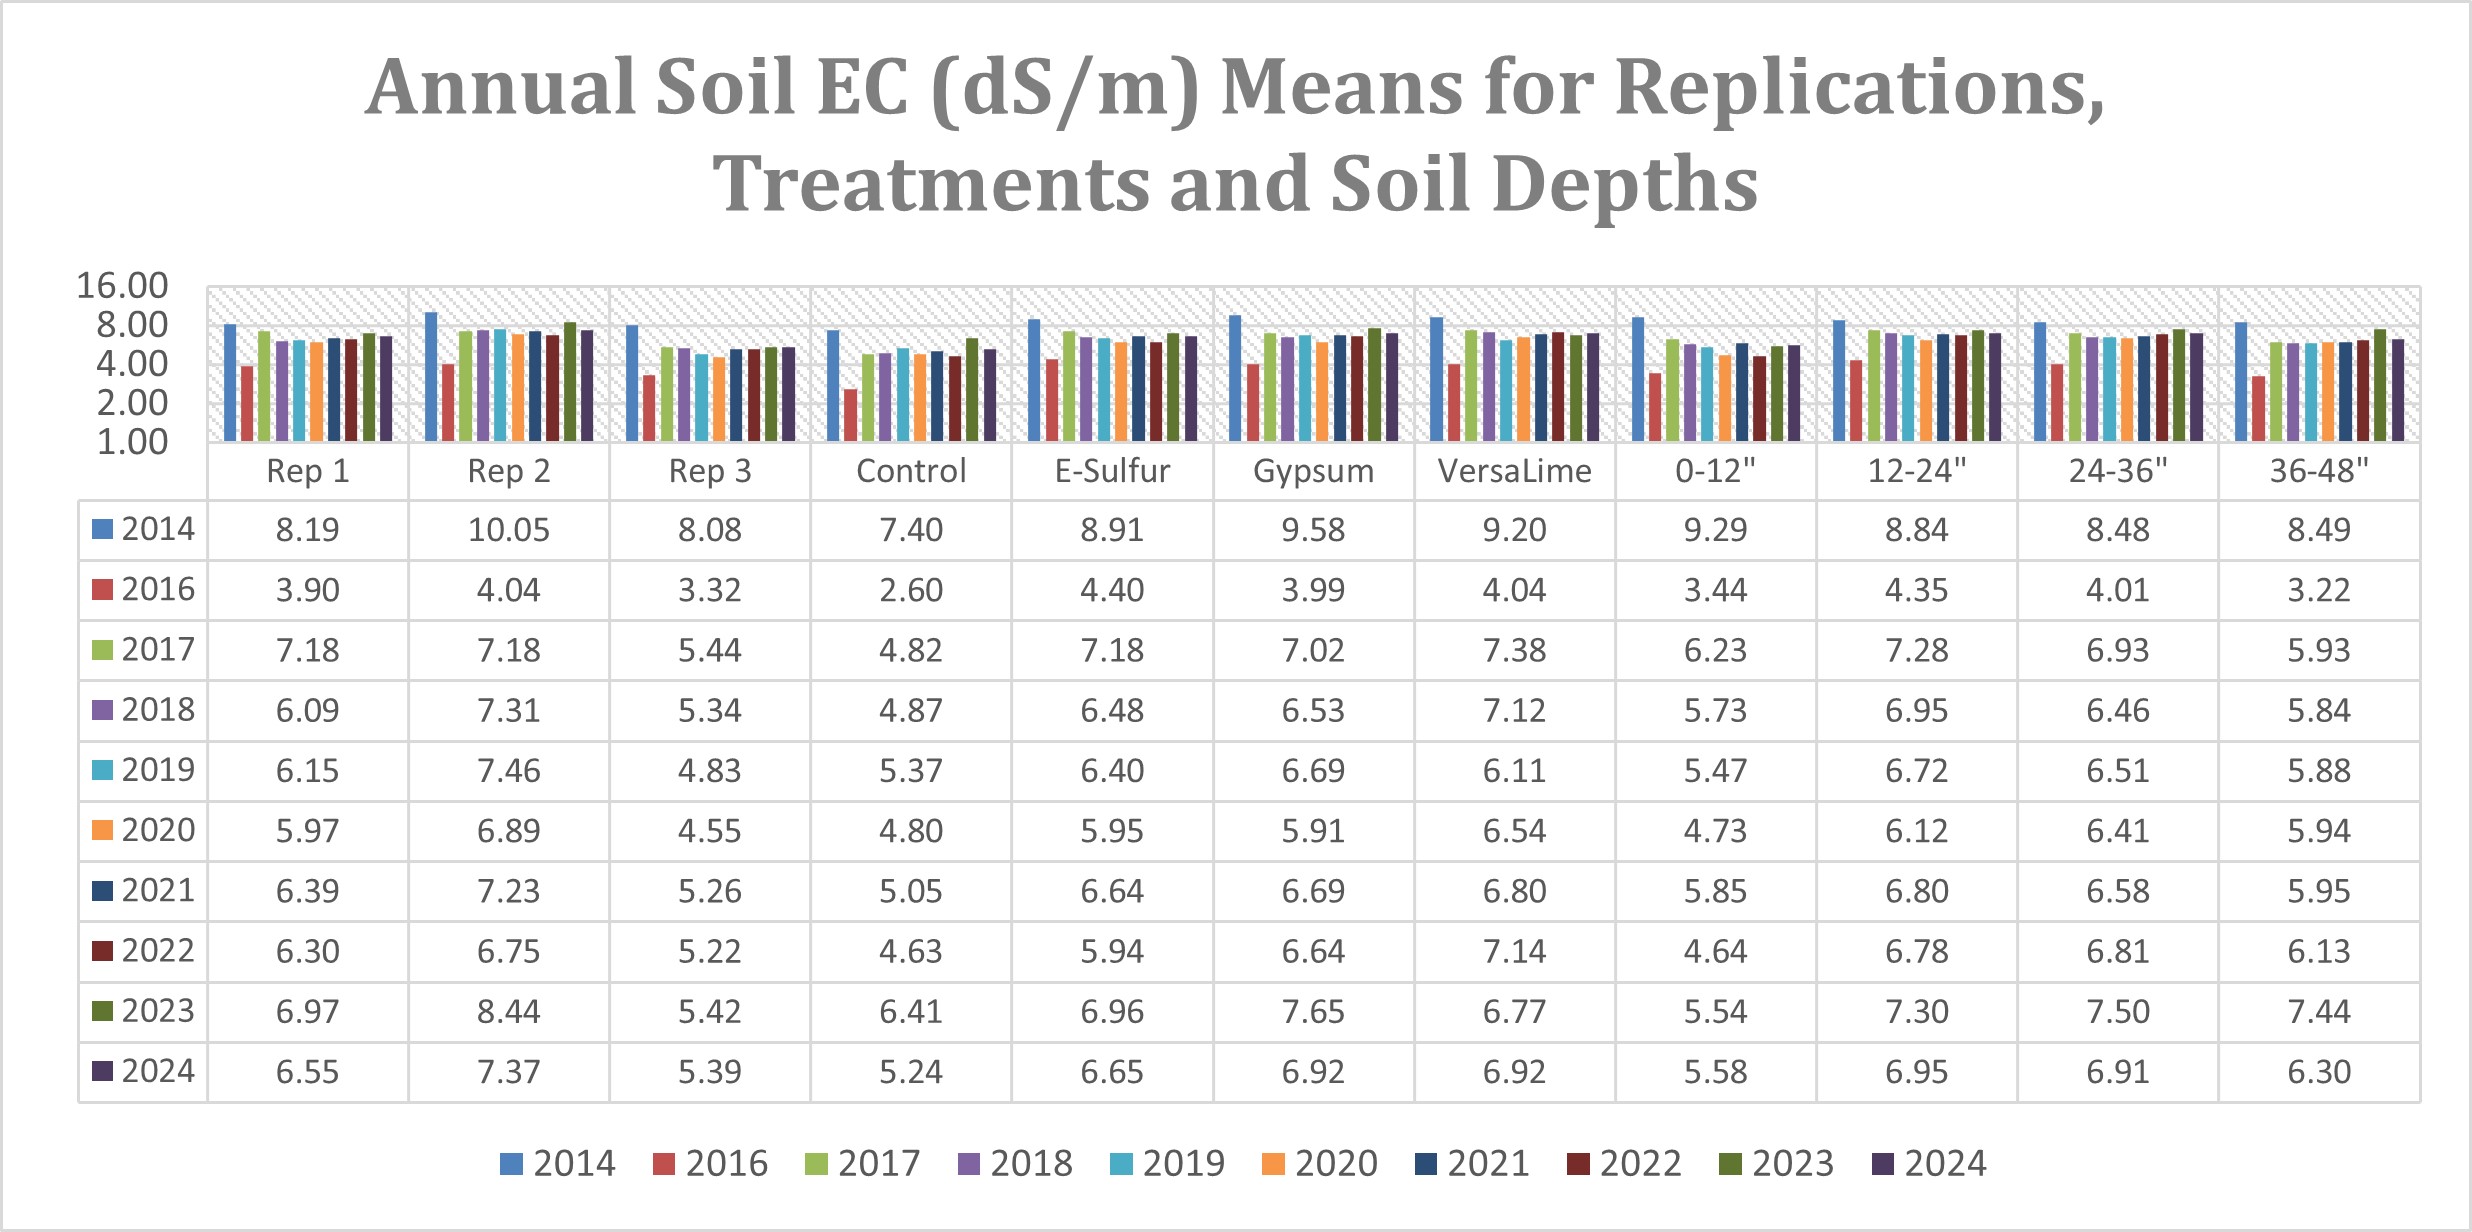
Soil EC levels in 2016, were significantly lower versus 2014 (at the time of tiling) despite shallow average annual growing-season groundwater depths due to excess rainfall and improved drainage under tiling. EC levels increased in 2017 and that trend continued in 2018-2023 despite the land being tiled and the average annual growing-season groundwater depths mostly deeper than the depth of the tiles (four-feet). The increase in salinity on tiled-land was a result of increased capillary rise of soil/groundwater water due to low rainfall and higher evapotranspiration. This indicates that tiling the land is just one-tool in the toolbox and lowering soil EC levels will need an optimum combination of low enough groundwater depths combined with sufficient rain and good soil water infiltration to push the salts into deeper depths. Sufficient rain will also result in higher moisture levels in the topsoil resulting in decreased capillary rise of groundwater and water-soluble salts. In 2024, EC means showed a slight decrease versus 2017-2023 under high rainfall (24.77-inches).
Differences in Soil SAR (Sodicity) Levels
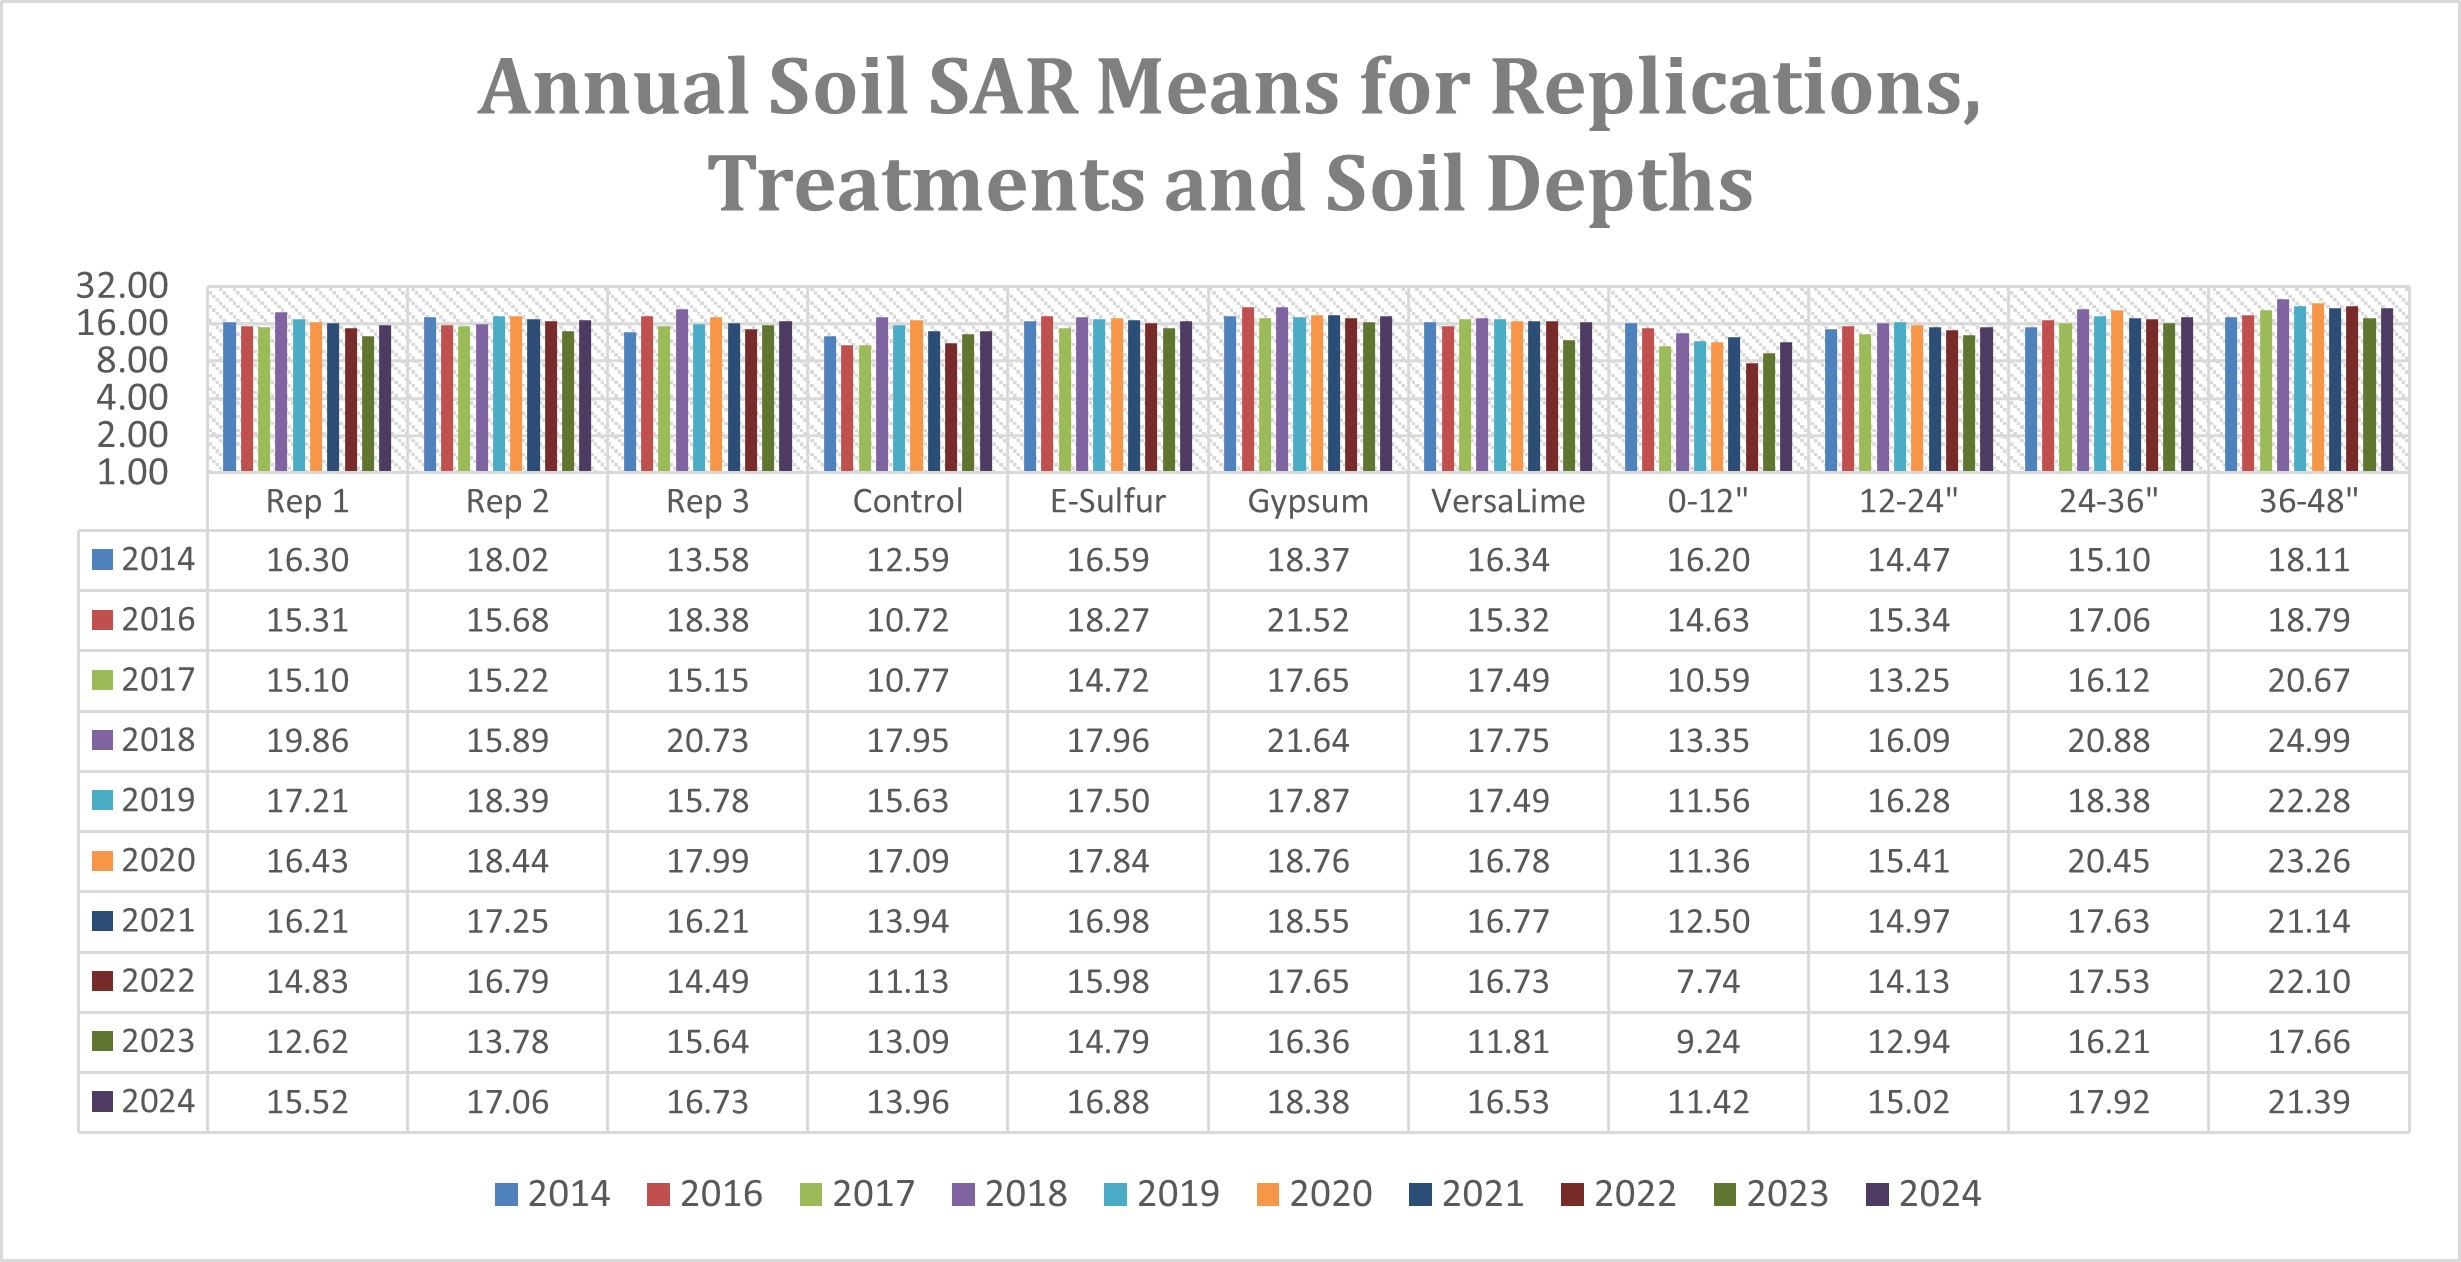
Changes in soil SAR levels have been inconsistent. That could be due to the relatively dry weather resulting in the slow breakdown of soil amendments for lowering sodicity from 2017-2023. The major change in the SAR level was in 2022 in the 0-12-inch depth that significantly decreased compared to 2014-2021. That trend continued in 2023. The SAR levels in the 0-12-inch depth in 2024 increased slightly versus 2022-2023. Details of soil SAR levels are shown in Figure 5.
Figure 5. Annual soil SAR means for replications, treatments and soil depths.
Differences in Soil pH Levels
Soil pH levels were generally consistent with the soil moisture levels at the time of sampling and have had no impact so far related to the application of soil amendments (Figure 6).
Figure 6. Annual soil pH means for replications, treatments and soil depths.
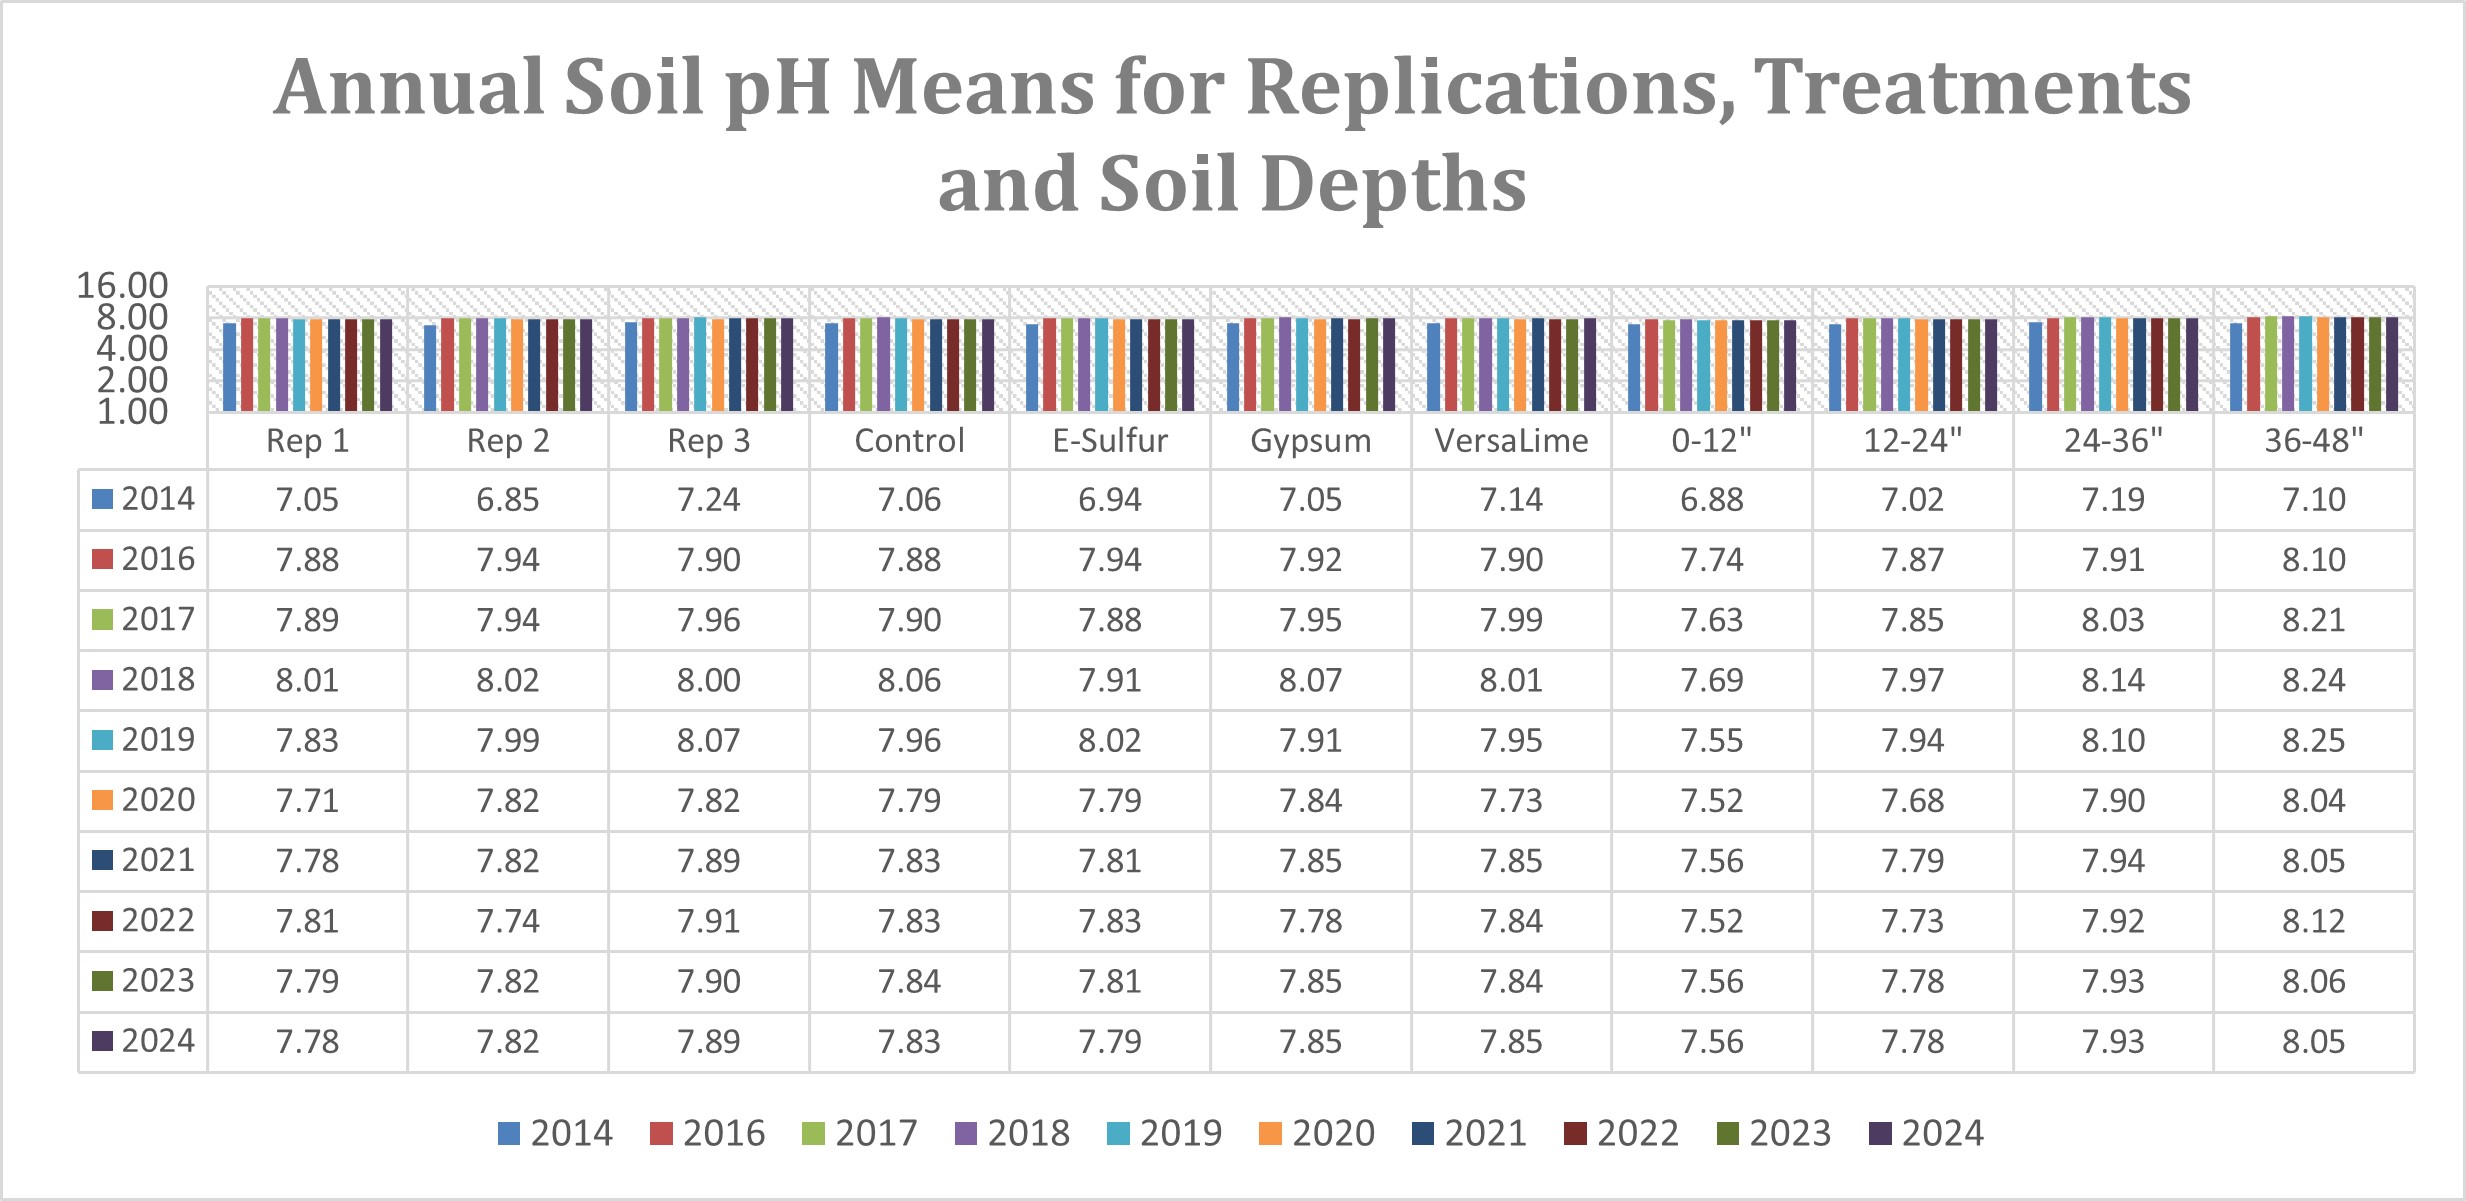
Overall, soil pH levels remained the highest in 2021 followed by 2018, 2019, 2017, 2016, 2022, 2020 and 2014. Replication 3 had the highest pH levels followed by replications 2 and 1. Replication 3 has the shallowest average annual growing-season groundwater depths followed by replications 2 and 1 in most years. VersaLime treatment had the highest pH levels followed by gypsum, control and E-sulfur treatments. Soil pH significantly increased with soil depth and 0-12-inch depths had the lowest pH levels, like SAR. The highest pH levels were at the 36-48 inch depths. Soil pH typically increases with moisture and soil moisture generally increases with increase in depth. Details of soil pH levels are shown in Figure 6.
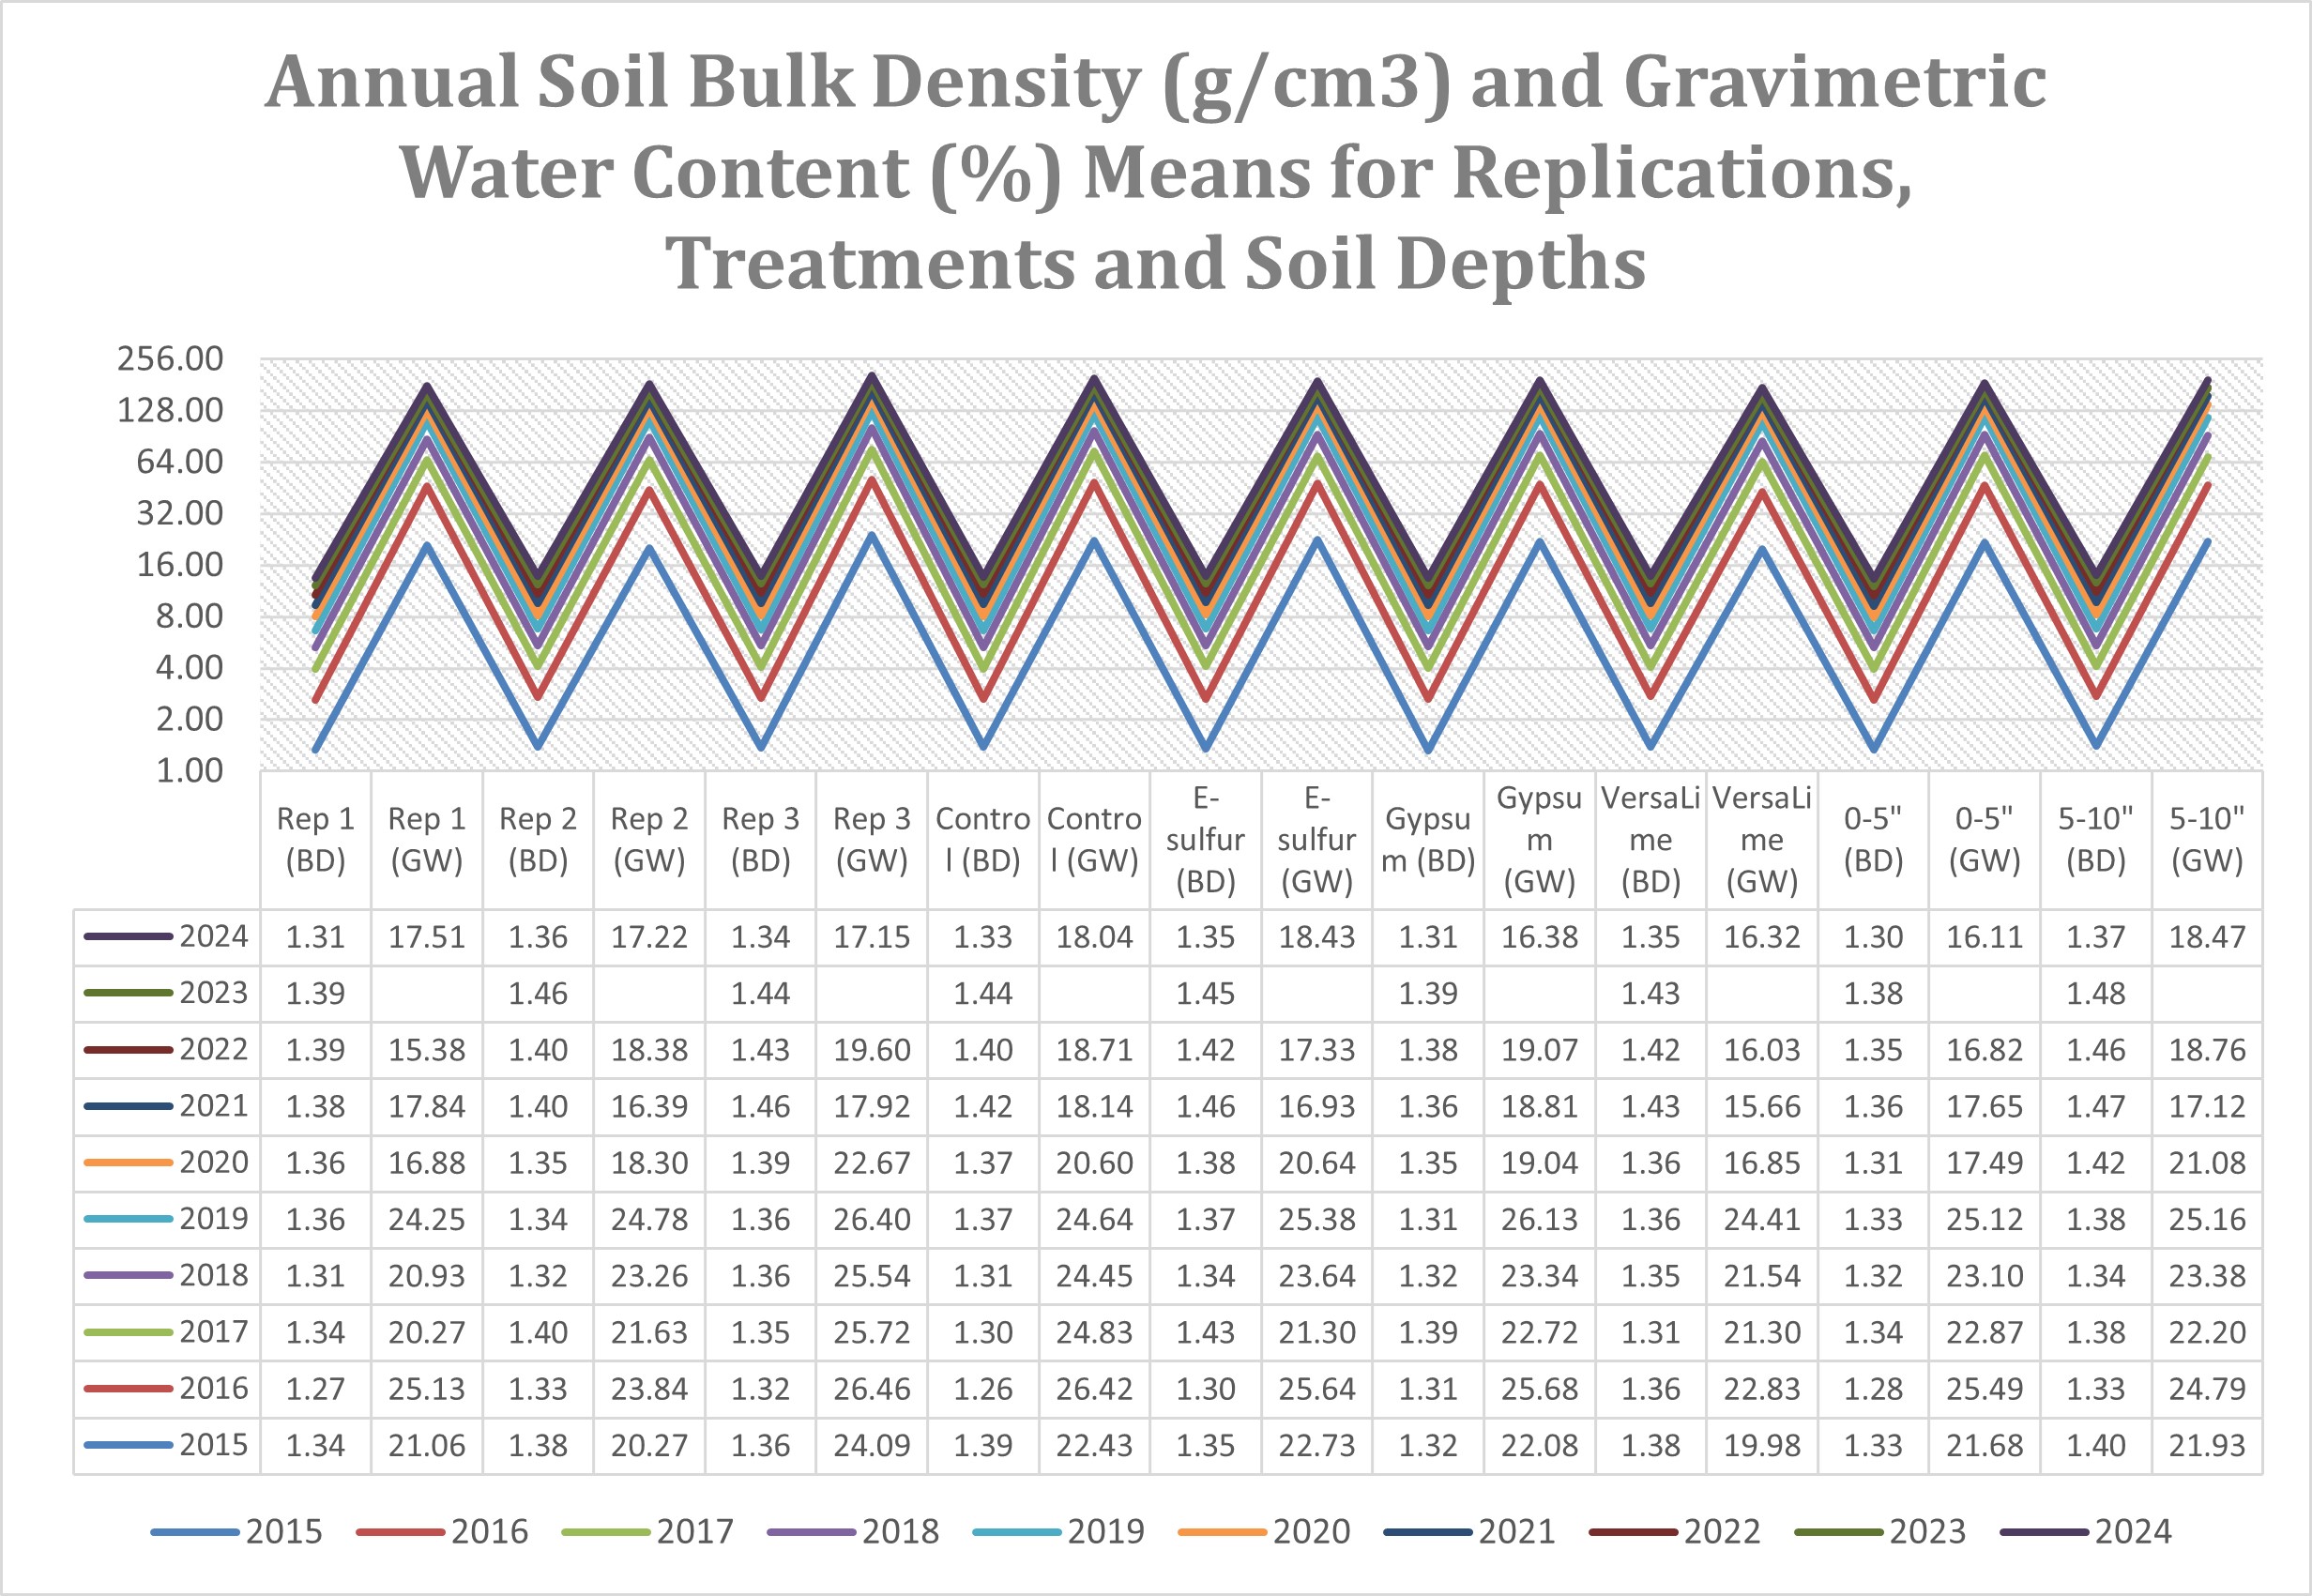
Differences in Soil Bulk Density Levels
There were no significant changes in soil bulk density due to the application of soil amendments. The site has not been tilled since 2015 when a perennial salt-tolerant grass mix was established. This may have also contributed to no significant differences in bulk density. There was a relationship between the gravimetric soil water contents and the corresponding bulk density. For example, 2023 was a very dry year and the bulk density levels remained one of the highest where the 2024 bulk density levels have been one of the lowest under wet weather.
Figure 7. Annual means of soil bulk density (g/cm3) and gravimetric water (%) levels for replications, treatments and soil depths.