2022: Determining the Economic Response of Sodic Soils to Remediation by Gypsum, Elemental Sulfur and Versalime in Northeast North Dakota on Tiled Fields
(Research Report, Langdon REC, November 2022)Due to the start of the wet weather cycle in North Dakota in 1993, especially in SE and NE, draining the excess soil water timely has been a top priority for producers. One of the ways to effectively drain excess soil water is to install subsurface drainage systems such as tiling. However, soil sodicity resulting in dense soil layers (due to the dispersion of soil particles) can significantly slowdown soil water infiltration. That can delay the removal of excess soil water despite the field being tiled.
The Langdon Research Extension Center Groundwater Management Trial mimics producer fields that were and still are tiled without assessing and remediating soil sodicity. It monitors long-term changes in soil chemical and physical properties on tiled plots with and without the application of soil amendments.
INTRODUCTION
This research report is an extension of an ongoing long-term research trial on a tiled saline and sodic site. The main objectives of the trial are:
- Does soil sodicity negatively affect tile drainage performance?
- Will tiling lower soil salinity under wet and dry weather conditions?
- Does the drained water from a tiled field increase salinity and sodicity levels of the surface water resources?
This abbreviated report only summarizes annual soil electrical conductivity (EC), sodium adsorption ratio (SAR), pH and bulk density results. If information about the trial background, objectives, location, site, description, design, methodology and complete set of data collected annually is needed, please contact the NDSU Langdon Research Extension Center:
Mail: 9280 107th Avenue NE, Langdon, ND 58249
Phone: (701) 256-2582
Email: ndsu.langdon.rec@ndsu.edu
RESULTS AND DISCUSSION
The findings below are based on the statistical analysis of soil electrical conductivity (EC dS/m), sodium adsorption ratio (SAR), pH and bulk density (g/cm3) and its corresponding gravimetric water content (GW in %). This was done to measure the differences in these properties at the time of tiling compared to after applying the soil amendments (treatments). The effects of annual growing-season rainfall and potential evapotranspiration (Penman) were noted on the resulting average annual growing-season groundwater depths measured from May 1 to October 31. The treatment means of EC, SAR and pH represent 2014 and 2016-2022 results of three replications for the zero to four-foot soil depths. The treatment means of groundwater depths and bulk density and its corresponding GW represent 2015 to 2022 results of three replications measured for zero to seven and a half-foot and zero to ten-inch soil depths respectively. Due to the dry weather during summer and fall, it was not possible to take water quality samples in 2022 from the tile drainage lift station as well as upstream and downstream of the lift station from the surface water drainage ditch in which tile drainage water drains. For previous annual water quality results, please contact the Langdon Research Extension Center.
Annual Changes in Weather and Soil Groundwater Depths
Changes in soil chemical properties are greatly influenced by the fluctuations in the weather such as annual evapotranspiration and rainfall (Figure 2) and resulting groundwater depths and capillary rise of soil water.
Figure 2. Annual growing-season potential evapotranspiration (Penman), actual rainfall and normal rainfall in inches measured from May 1 to October 31.
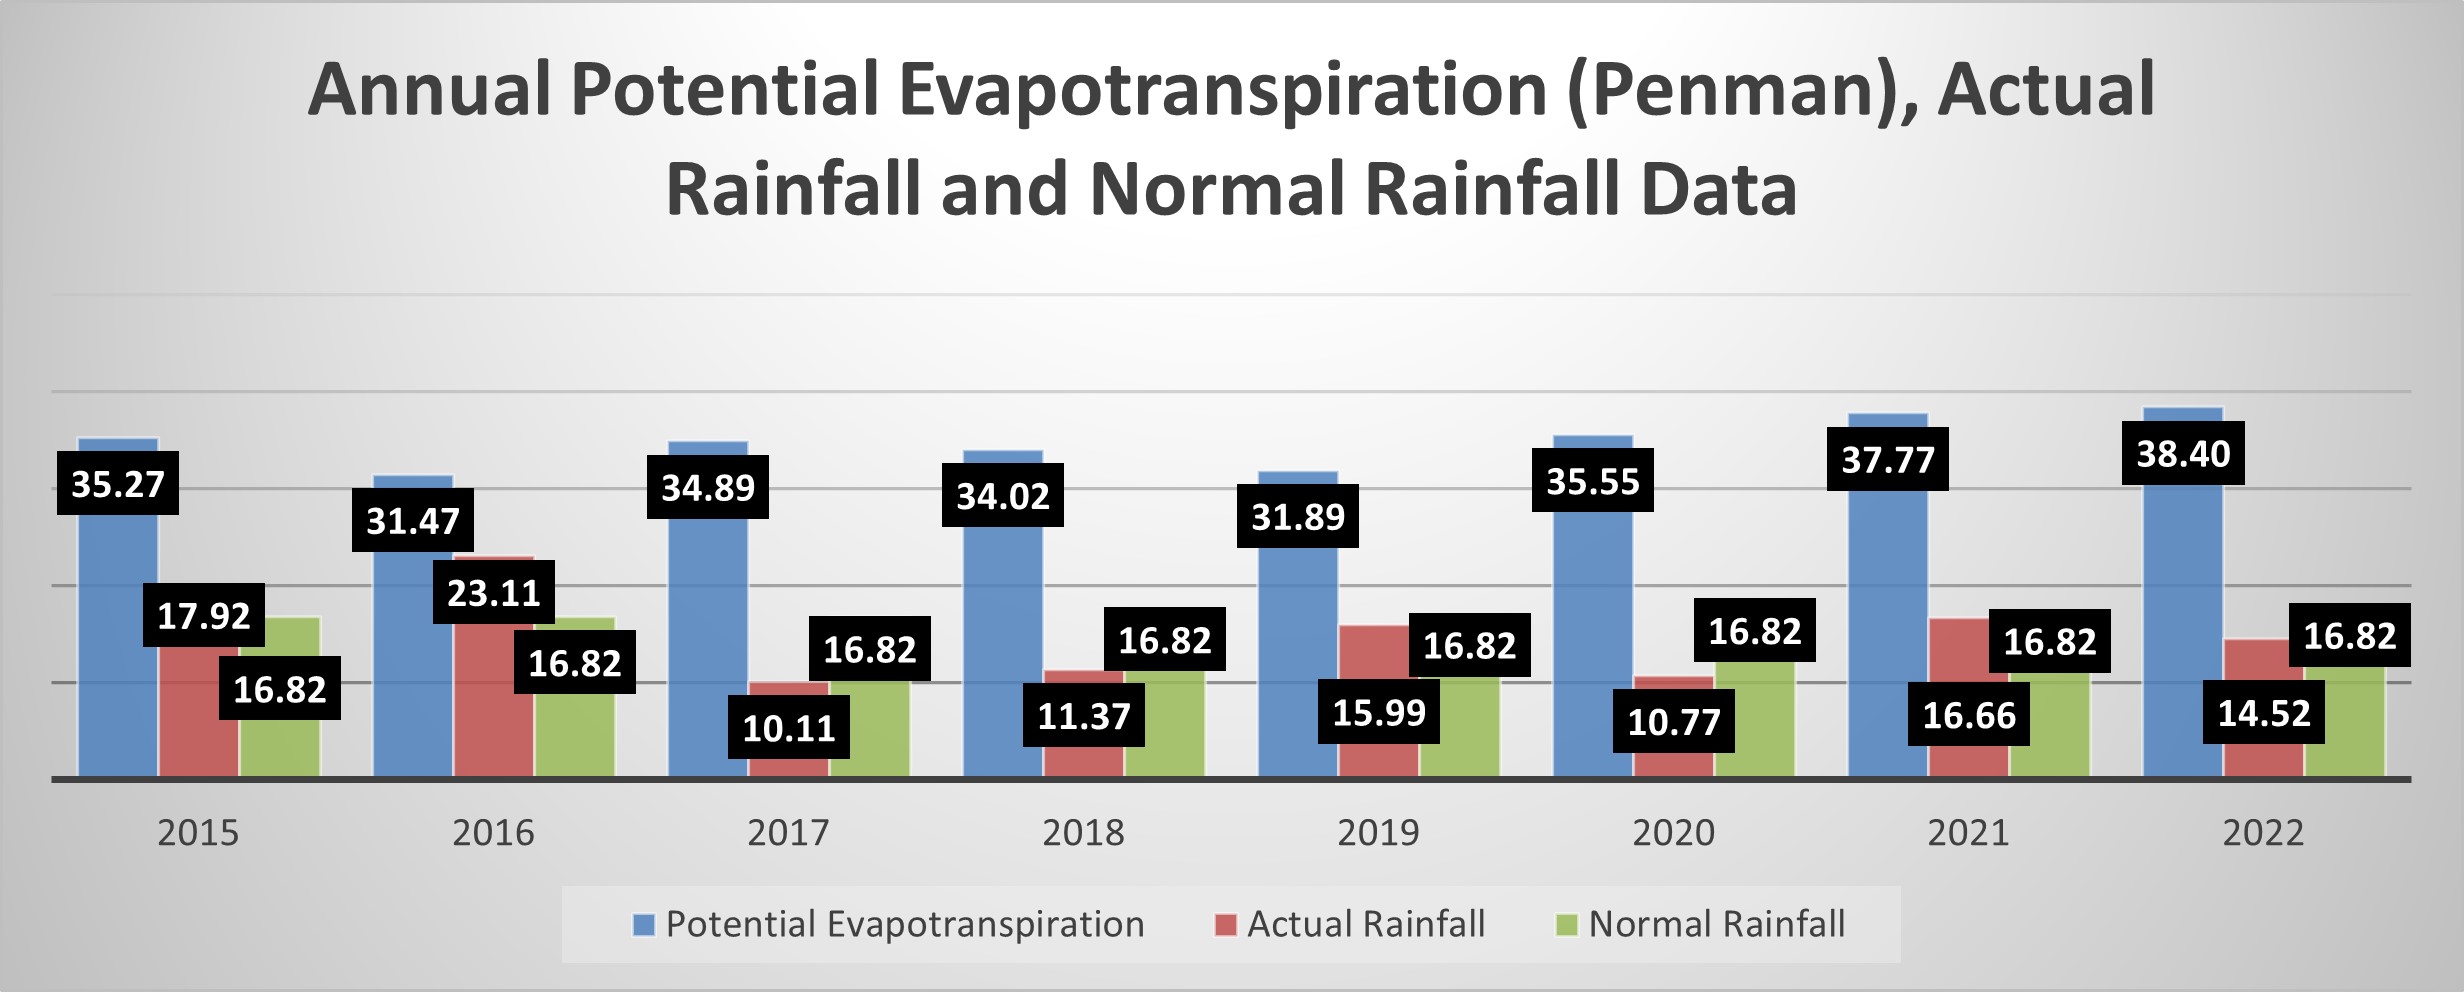
Increased evapotranspiration versus rainfall generally results in lower groundwater depths, however, can cause less leaching of soluble salts, increased capillary rise of soil water and slower dissolution of soil amendments. A smaller gap between these two could result in shallower groundwater depths, however, under good soil water infiltration and improved drainage, not only excess salts can be moved out of the fields but soil amendments can also produce favorable results. A smaller gap between evapotranspiration and rainfall will result in reduced capillary rise of soil water (wicking up) as capillary water moves from higher to lower moisture levels. In 2016, the gap between evapotranspiration and rainfall was smallest of the eight-years and the infiltration was still good as higher levels of soluble salts were neutralizing the dispersion caused by sodicity. This resulted in the highest decrease in soil salt levels in 2016 since the site was tiled in 2014. In 2017, there was a significant increase in soil salt levels compared to 2016, which could be due to an increase in the capillary rise of soil water due to the greater differences between annual evapotranspiration and rainfall. That trend continued in 2018-2022 due to the drier weather.
It is important to note that while the total annual evapotranspiration and rainfall numbers are important, they do not reflect the weather trends for the entire growing-season. For example, from May 1 to October 31, 2021, Langdon Research Extension Center NDAWN station recorded 37.77 inches of total potential evapotranspiration and 16.66 inches of actual rainfall versus a normal of 16.82 inches. That means Langdon area received close to its normal rain in 2021. During the early part of the 2021 growing-season from May 1 to August 8, Langdon NDAWN recorded 25.62 inches of total potential evapotranspiration and only 6.43 inches of actual rainfall versus a normal of 11.42 inches. The gap of 19.19 inches between total annual evapotranspiration and actual rainfall and 43.69 percent less rainfall versus normal for that period created moderate to severe drought. On August 9, the Langdon area received 3.68 inches of rain and kept getting significant showers afterwards. Overall, Langdon NDAWN recorded 12.16 inches of total annual evapotranspiration and 10.22 inches of rain versus a normal of 5.40 inches from August 9 to October 31. So, during the latter part of the growing-season, the gap between total annual evapotranspiration and rainfall was only 1.94 inches with 189.25 percent actual rain compared to normal. It was important to receive the much-needed moisture during that time, but most of the growing-season was over by then.
Figure 3 has the average annual growing-season groundwater depth means for replications and treatments for 2015-2022. These means of groundwater depths represent actual annual measurements of groundwater depths measured from May 1 to October 31 on a weekly basis.
Figure 3. Annual means of average growing-season groundwater depths for replications and treatments in feet measured from May 1 to October 31 on a weekly basis.
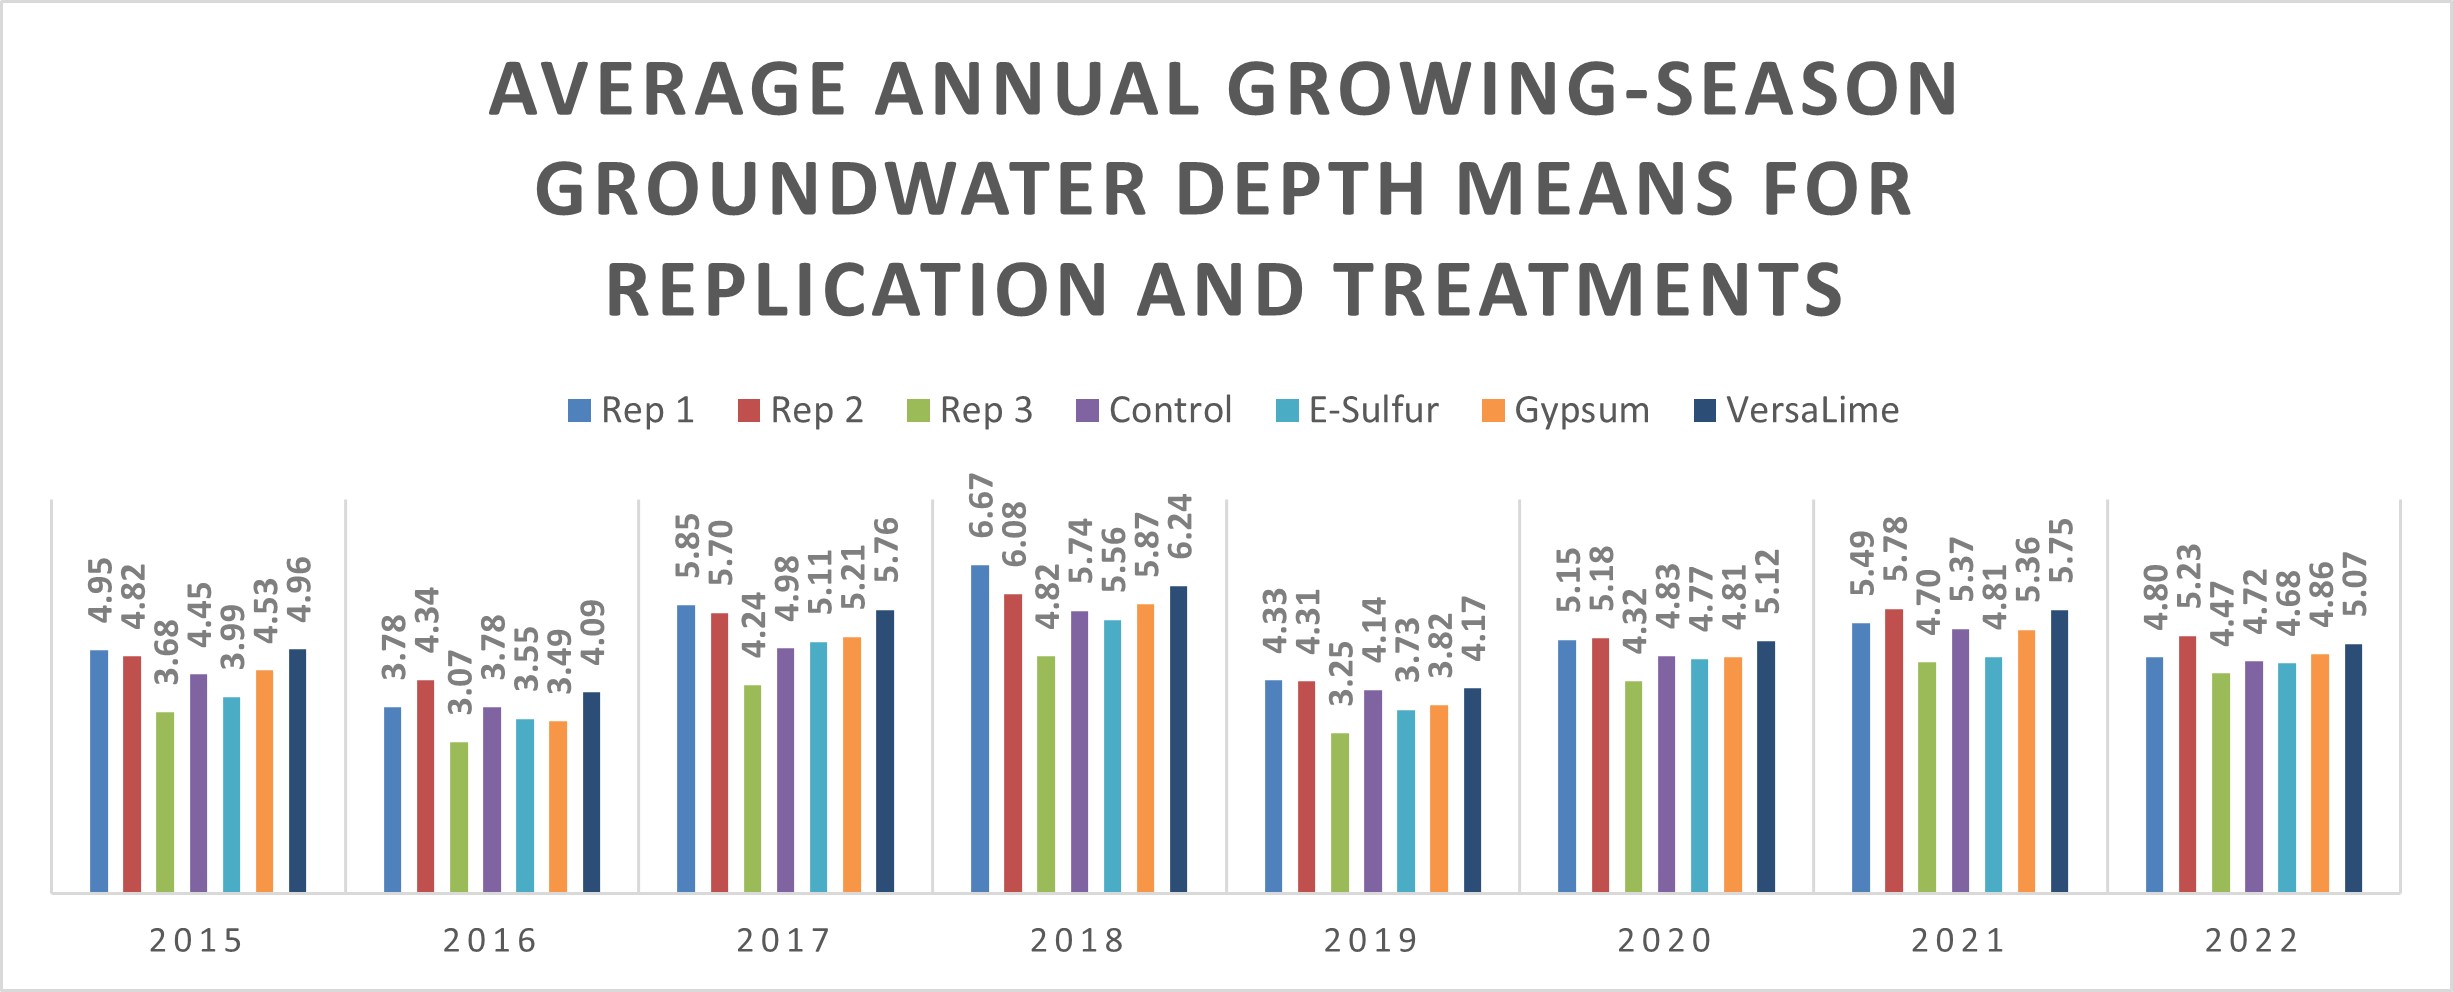
Note: In 2015, groundwater depths were only measured from mid-June to the end of October.
The 2016 average growing-season groundwater depths for treatments and replications were the shallowest (3.07 to 4.34 feet deep). Groundwater depths in 2018 were the deepest (4.82 to 6.67 feet deep). Replication 3 had the shallowest average annual growing-season groundwater depths compared to replications 1 and 2 in all years. VersaLime treatment had the deepest depths during most years.
Differences in Soil Electrical Conductivity (Salinity) Levels
Soil EC levels have been directly related to the annual growing-season rainfall and resulting moisture levels in the topsoil.
Figure 4. Annual soil EC (dS/m) means for replications, treatments and soil depths.
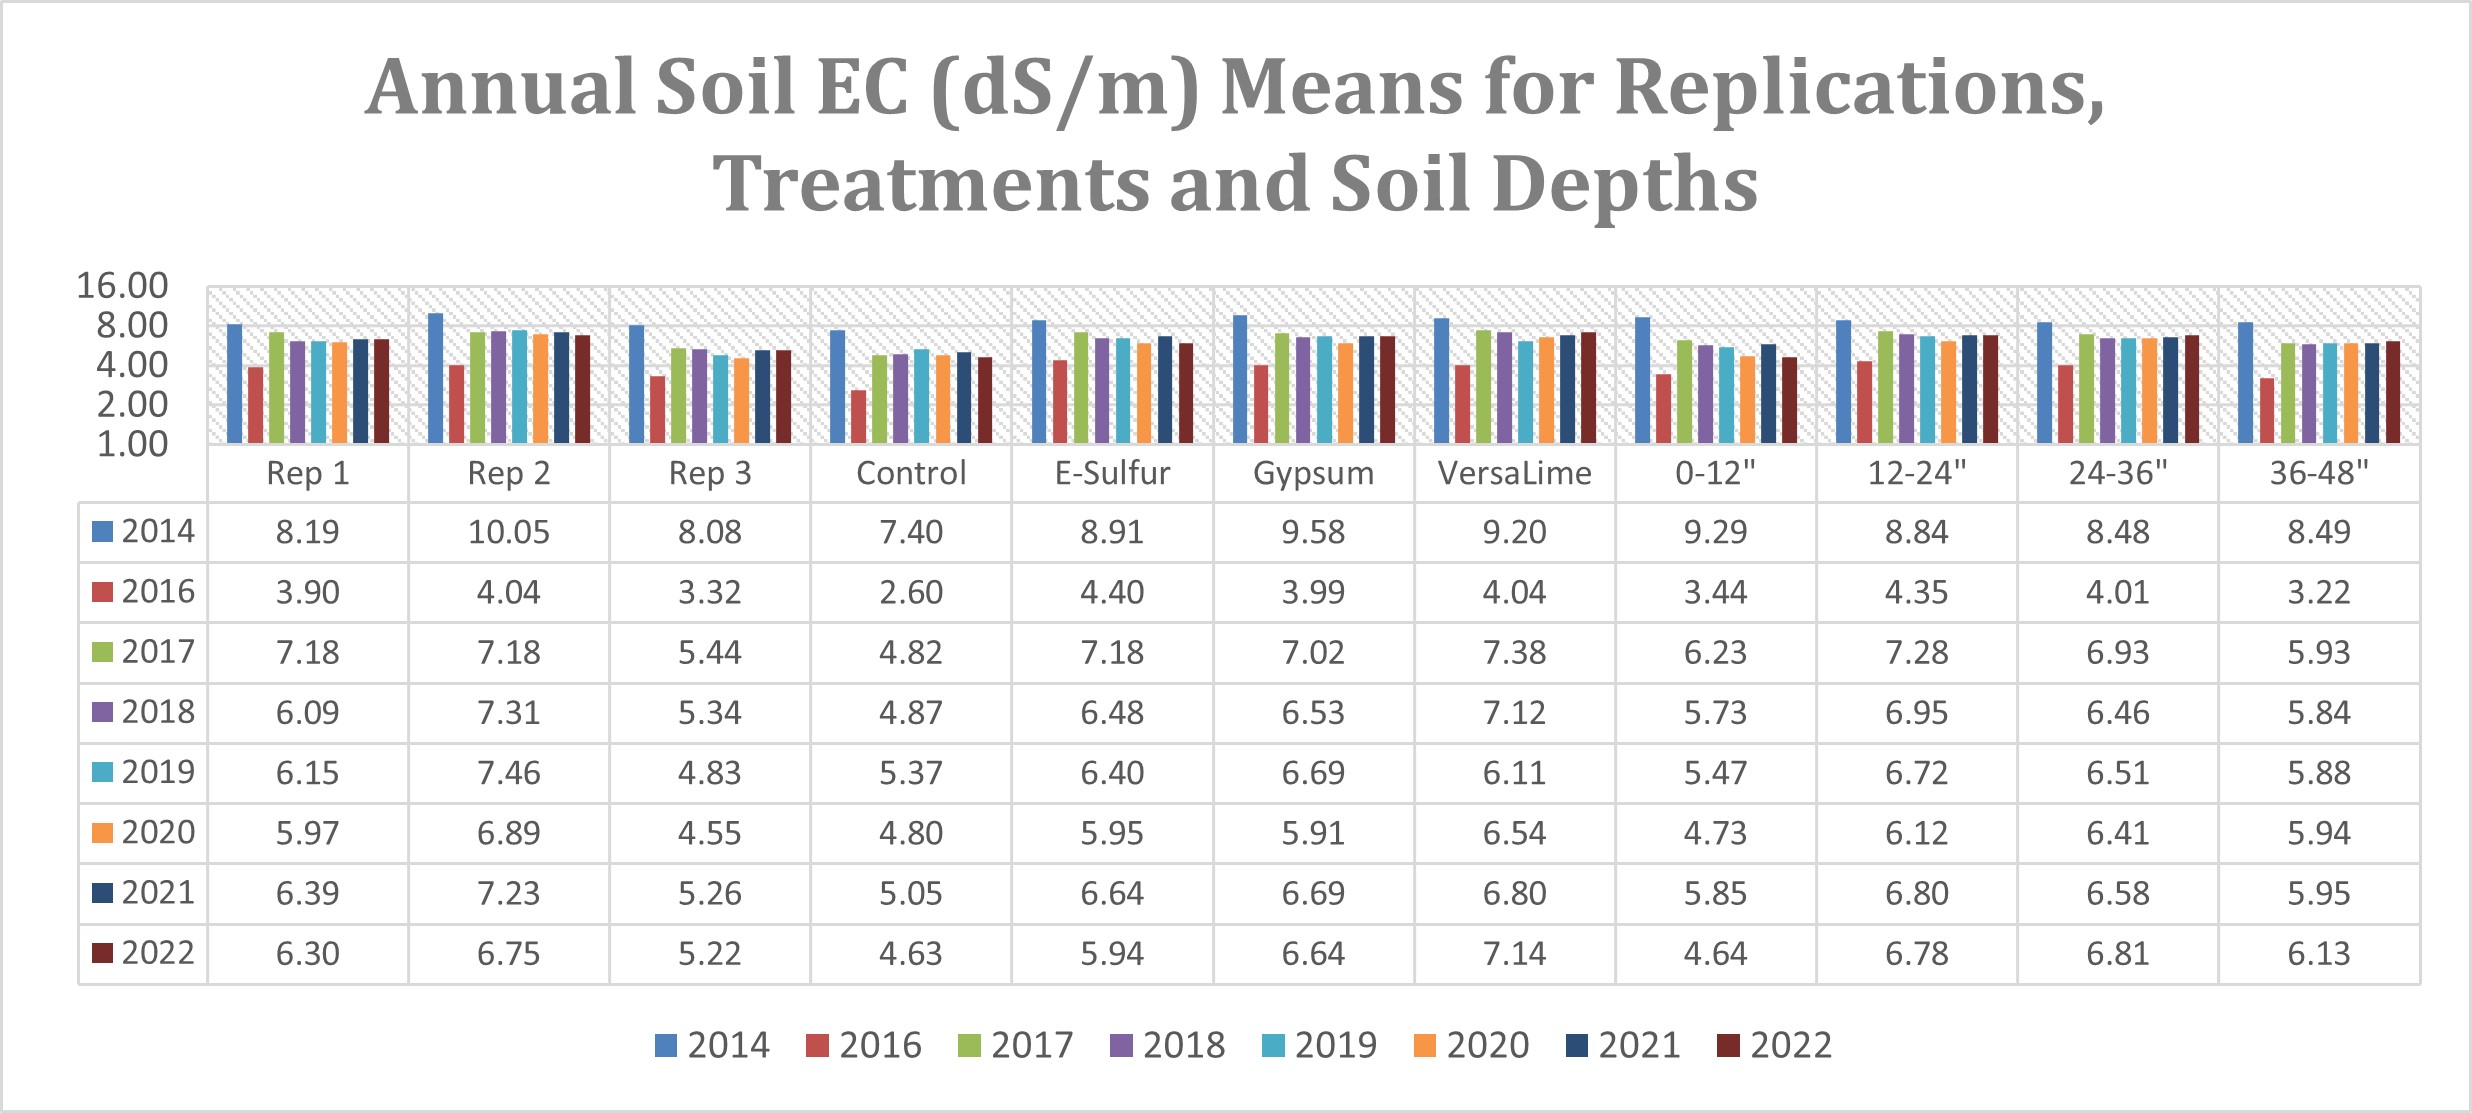
Soil EC levels in 2016, were significantly lower despite shallow average annual growing-season groundwater depths due to excess rainfall and improved drainage under tiling. EC levels increased again in 2017 and that trend continued in 2018-2022 despite the land being tiled and the average annual growing-season groundwater depths being deeper than the depth of the tiles. That was a result of increased capillary rise of soil water due to low rainfall and higher evapotranspiration. This defies the common belief that only lowering the groundwater depths will cause excess salts to leach out. Lowering soil EC levels will need an optimum combination of low enough groundwater depths combined with sufficient rain and good soil water infiltration to push the salts into deeper depths. The importance of good soil water infiltration is also evident from the fact that the highest EC levels were observed in 12-24 and 24-36-inch soil depths. This could be an indication of decent infiltration through the first foot (especially under lower sodicity levels) with much slower water movement through the second and third feet of soil resulting in higher levels of salts. Sufficient rain will also result in improved moisture levels in the topsoil resulting in decreased capillary rise. Based on soil test EC levels, establishing a salt-tolerant annual crop (barley, oat) or perennial salt-tolerant grass mix is also very important as that will reduce evaporation and consequently capillary rise.
EC levels in 2014 were the highest followed by the levels in 2021 and 2017-2019, 2022, 2020 and 2016. Replication 2 had the highest EC levels followed by replications 1 and 3. VersaLime treatments had the highest levels followed by gypsum, E-sulfur and control treatments. The highest EC levels were found in the 12-24-inch soil depths followed by 24-36-inch, 36-48 inch and 0-12-inch depths. Details of soil EC (dS/m) levels are shown in Figure 4.
Differences in Soil Sodium Adsorption Ratio SAR (Sodicity) Levels
The major change in 2022 was that the SAR levels in the 0-12-inch depth significantly decreased versus 2014-2021. Soil SAR levels in the 12-24, 24-36 and 36-48-inch depths remained unchanged (Figure 5). This could be due to the high precipitation during 2022 spring and early growing-season. Apart from this change, soil SAR levels have been inconsistent.
Figure 5. Annual soil SAR means for replications, treatments and soil depths.
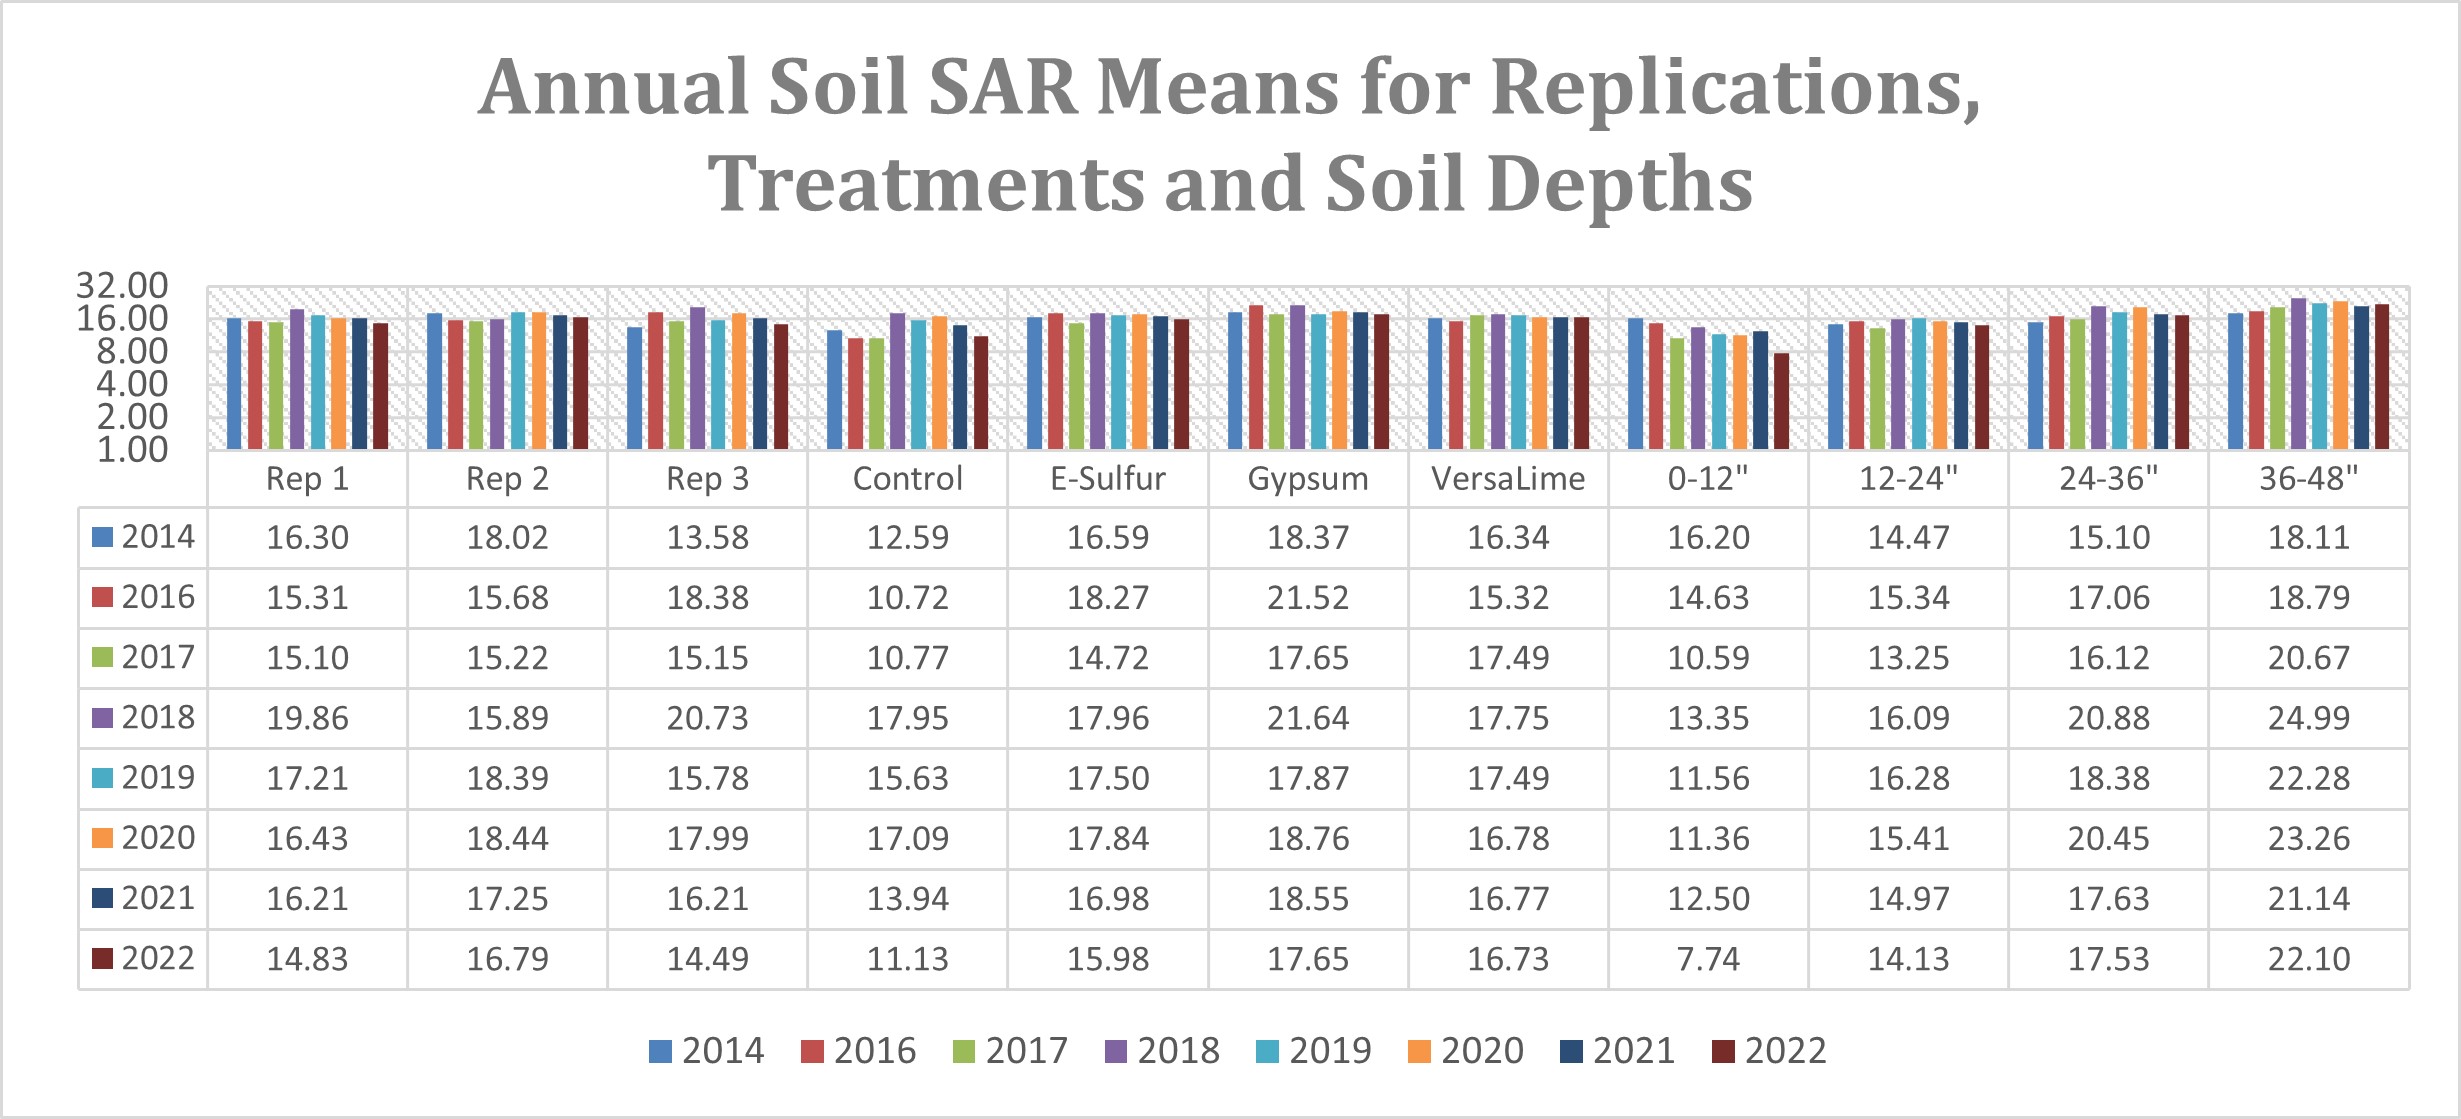
Overall, SAR remained the highest in 2018 followed by 2020, 2019, 2016, 2014, 2022, 2017 and 2021. Replication 2 had the highest SARlevels followed by replications 1 and 3. Gypsum treatment had the highest levels followed by E-sulfur, VersaLime and control treatments. In addition, soil SAR levels increased with soil depth with 0-12-inch depths having the lowest SAR levels and 36-48-inch depths having the highest SAR levels. Details of soil SAR levels are shown in Figure 5.
Differences in Soil pH Levels
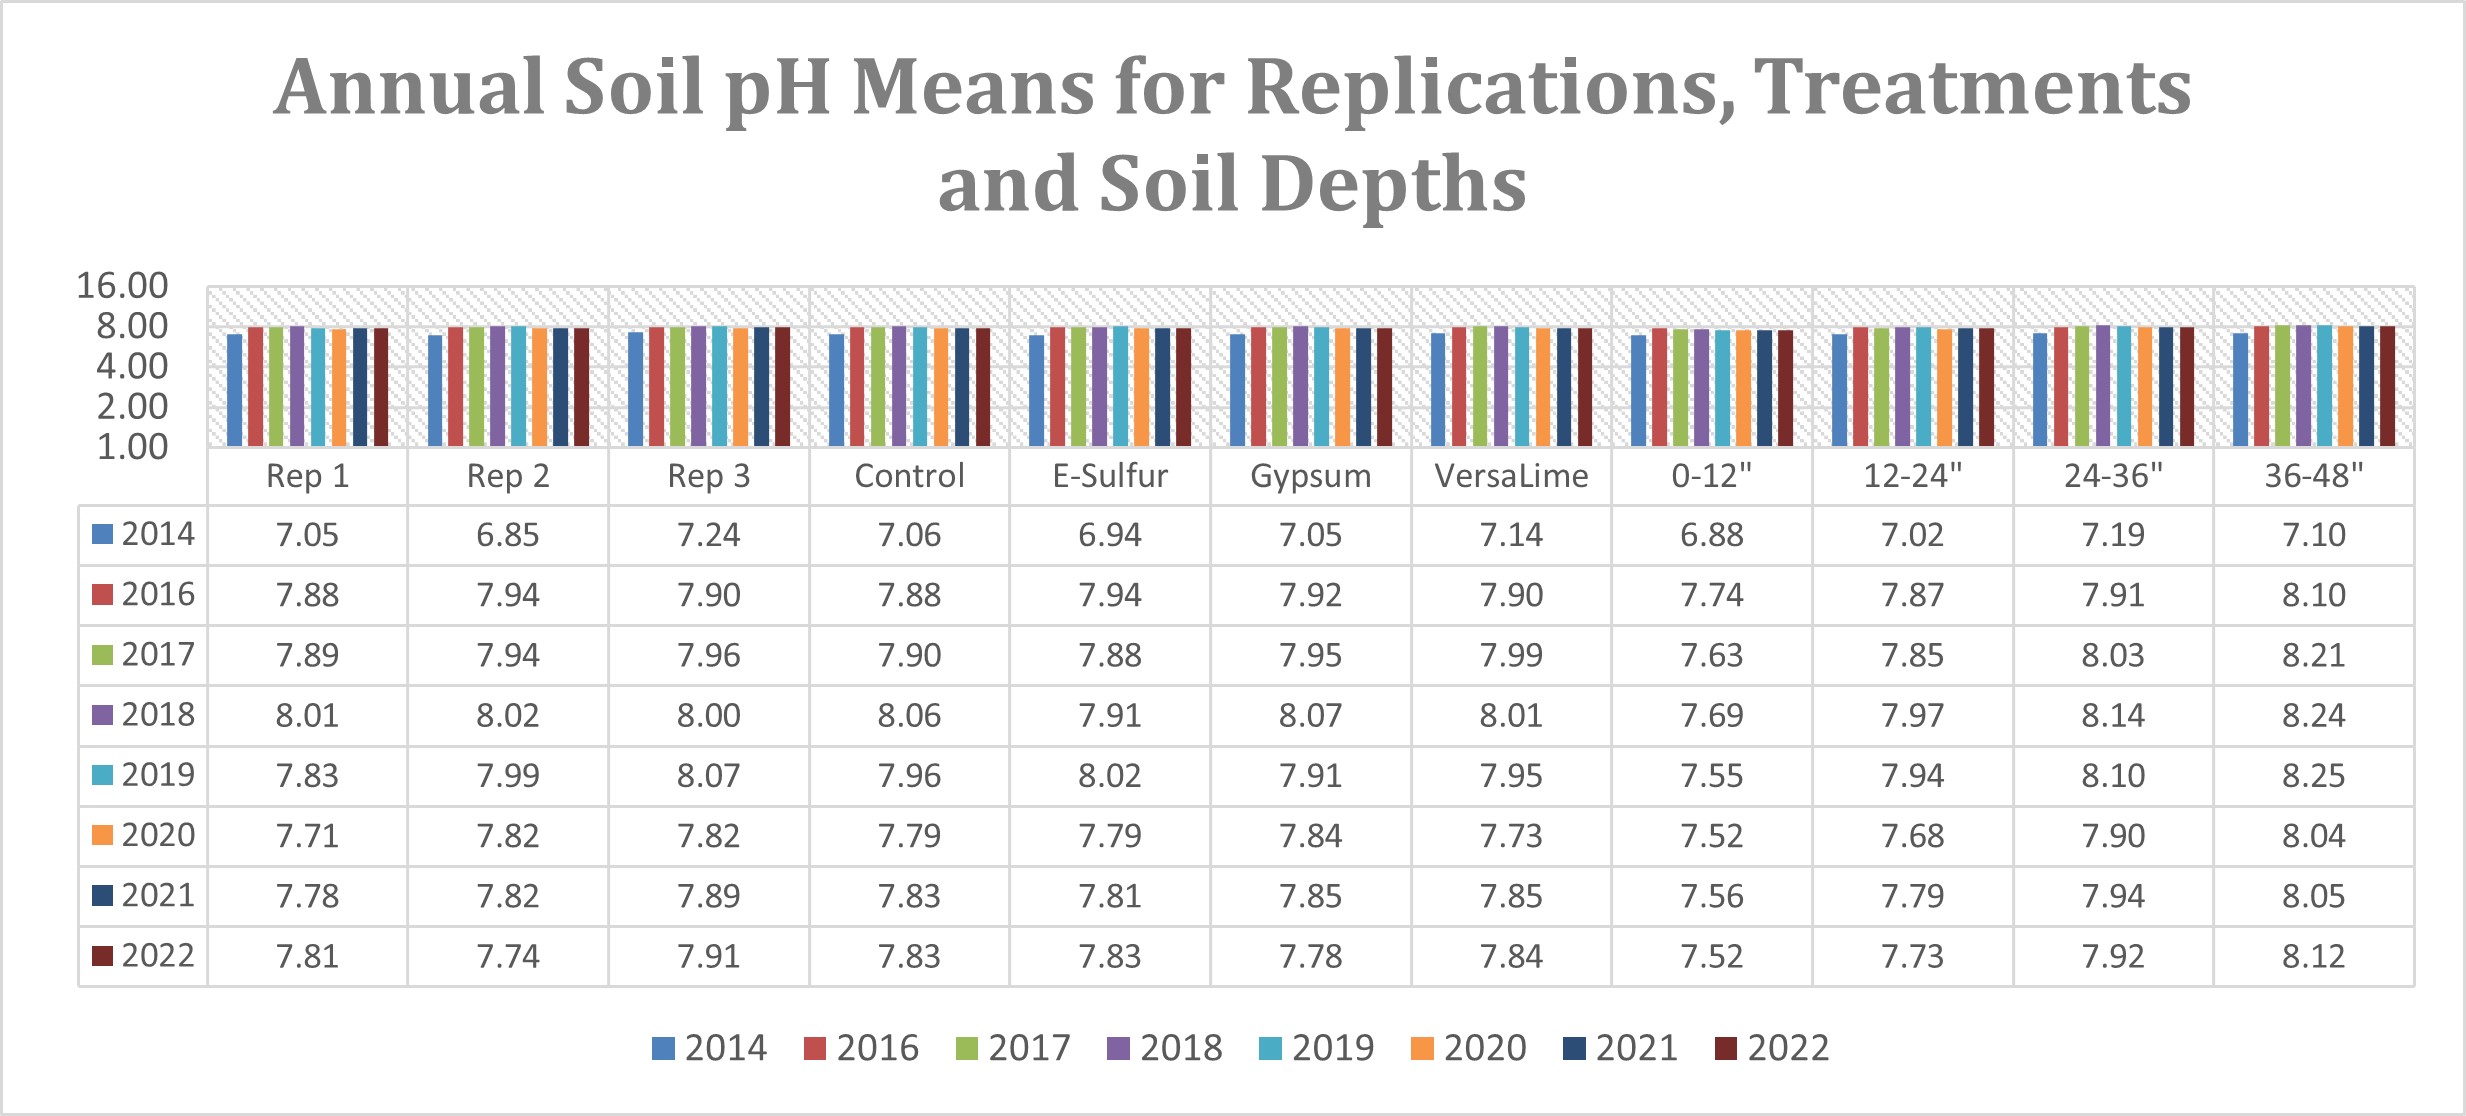
Soil pH levels were generally consistent with the soil moisture levels at the time of sampling and have had no impact so far related to the application of soil amendments (Figure 6).
Overall, soil pHlevels remained the highest in 2021 followed by 2018, 2019, 2017, 2016, 2022, 2020 and 2014. Replication 3 had the highest pHlevels followed by replications 2 and 1. That is interesting as generally replication 3 has the shallowest average annual growing-season groundwater depths followed by replications 2 and 1 in most years. VersaLime treatment had the highest levels followed by gypsum, control and E-sulfur treatments. Like SAR, soil pH significantly increased with soil depth and 0-12-inch depths had the lowest pH levels, whereas, 36-48-inch depths had the highest pH levels. That is another indication of soil pH increasing with moisture as soil moisture generally increases with increase in depth. Details of soil pH levels are shown in Figure 6.
Figure 6. Annual soil pH means for replications, treatments and soil depths.
Differences in Soil Bulk Density Levels
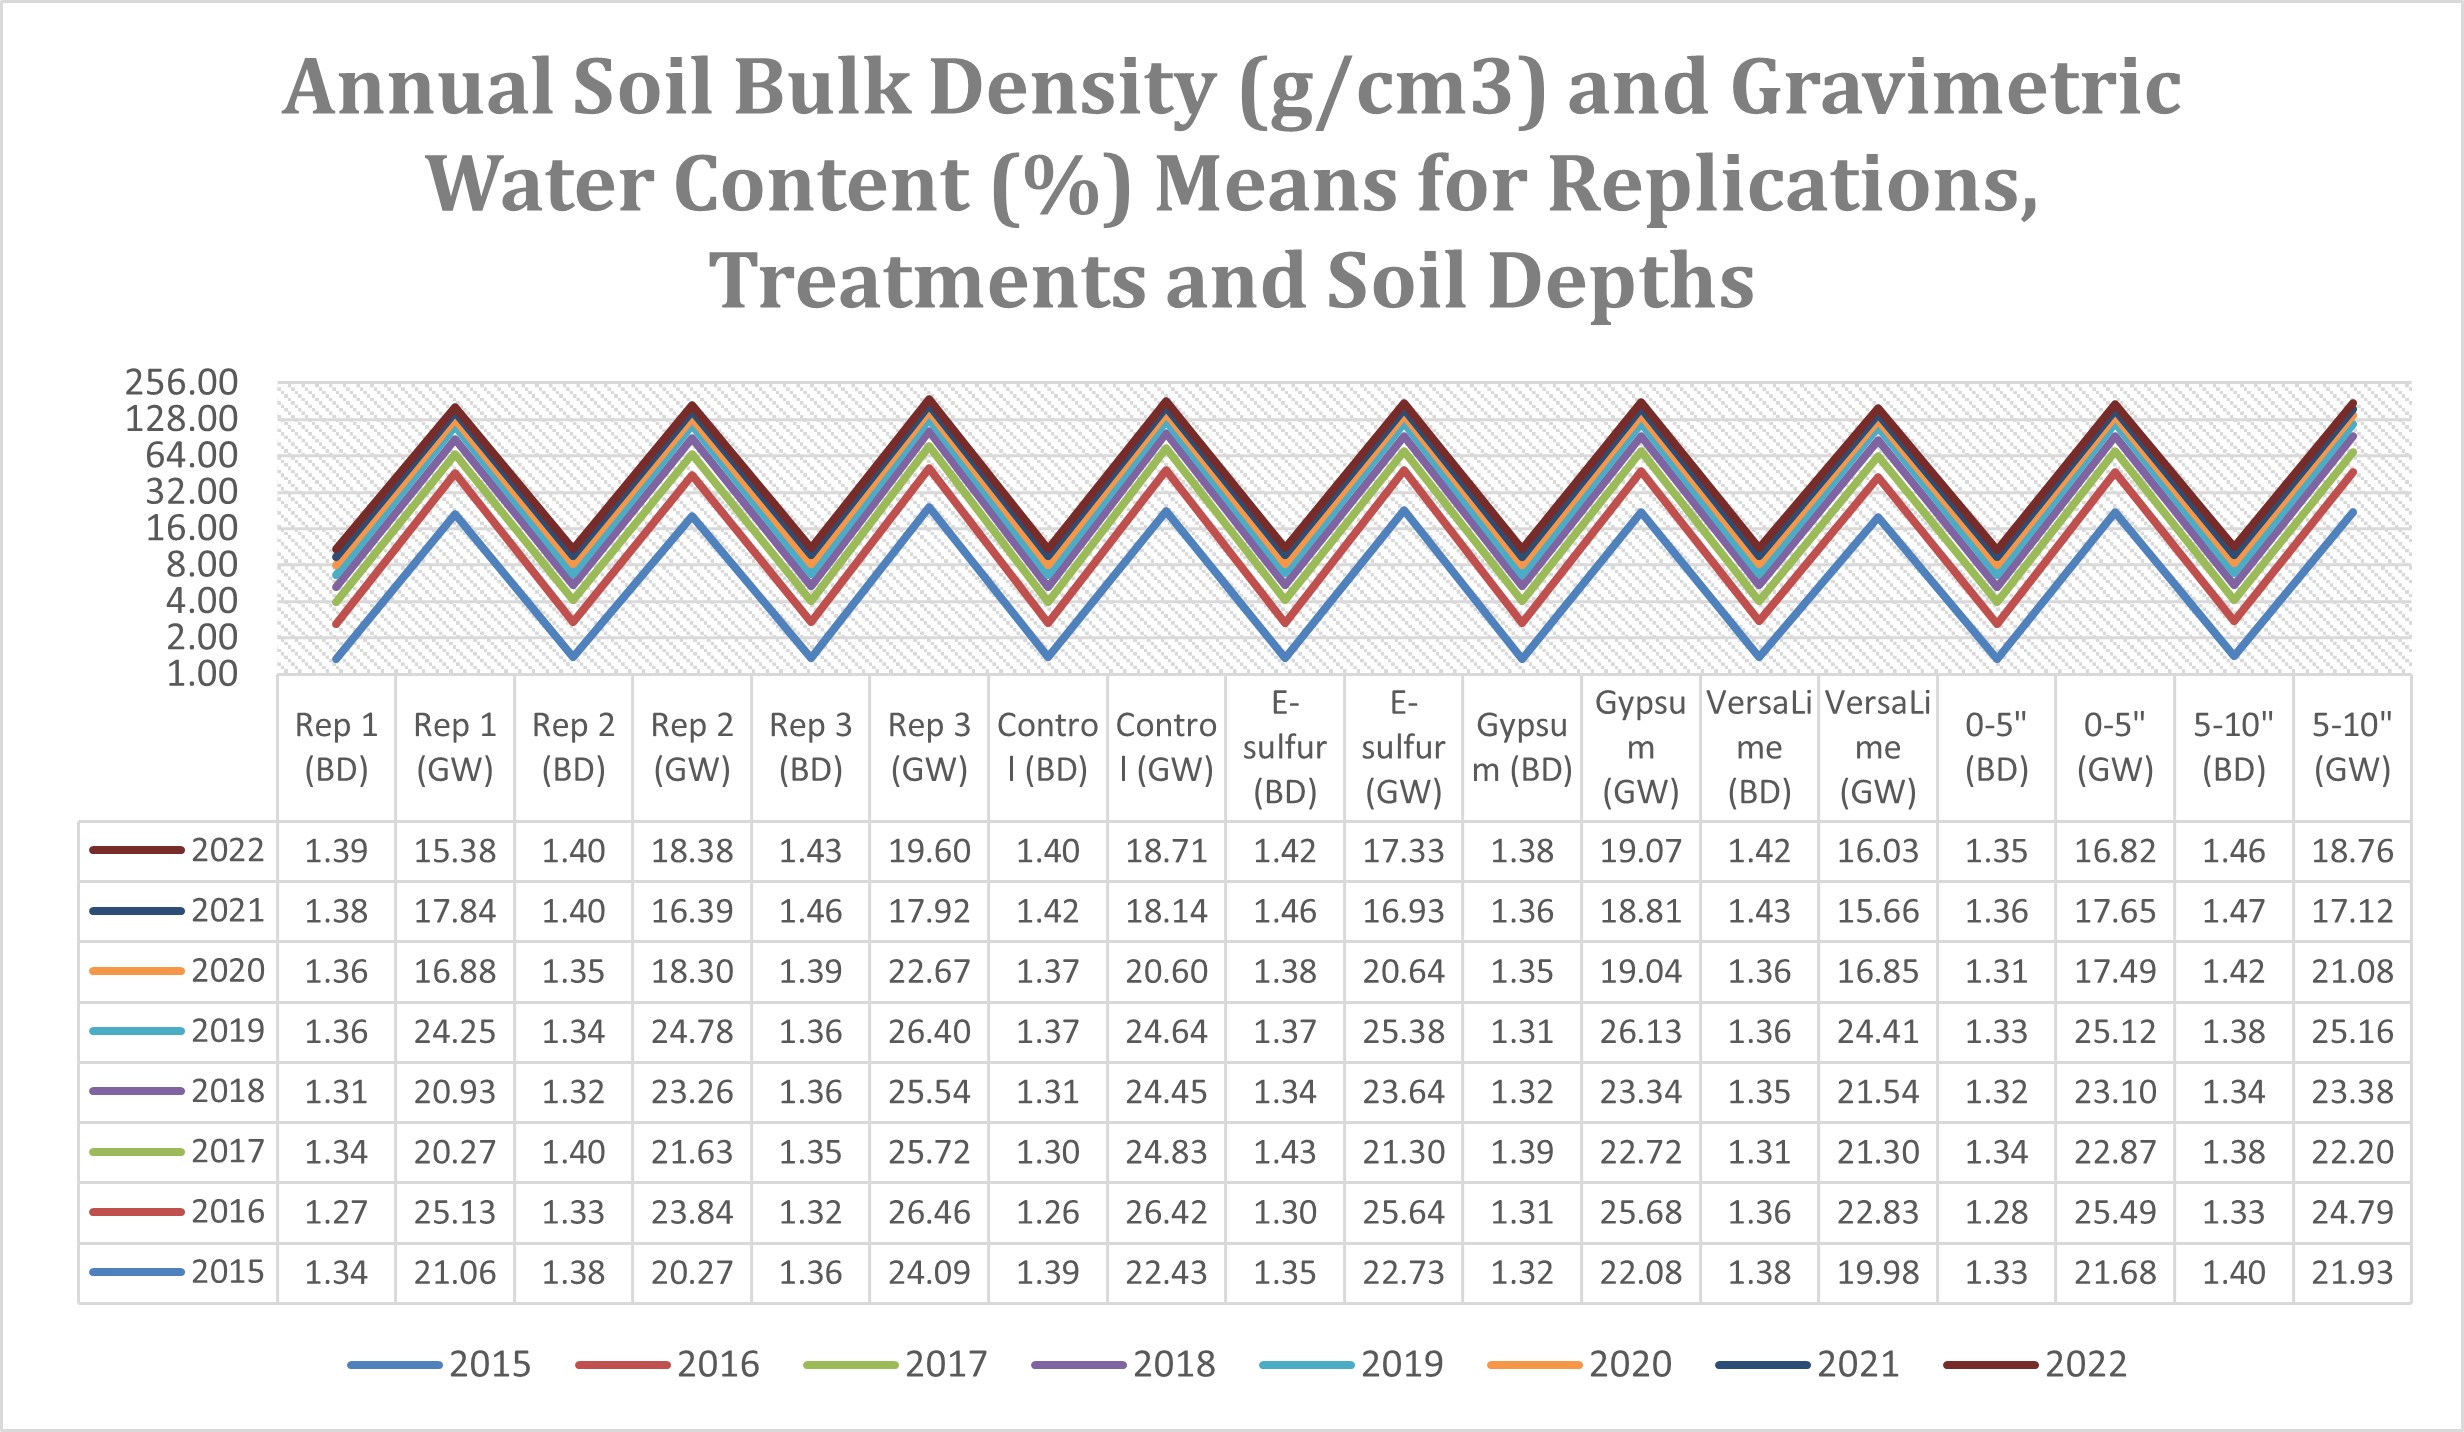
Soil bulk density increased with soil depths. Despite not being a clear trend, bulk density increased as the gravimetric soil water content decreased (Figure 7).
Figure 7. Annual means of soil bulk density (g/cm3) and gravimetric water (%) levels for replications, treatments and soil depths.