Title

Comparing Conventional-till versus No-till in NE ND - 2022

(Research Report, Langdon REC, November 2022)
Summary

Topsoil blowing is a common sight in North Dakota. A 2012 NDSU study that revisited several sites in North Dakota, concluded that the average loss of topsoil in the last 50-years was around eight to nine-inches. A reduced form of tillage such as no-till or minimum-till can result in minimal soil disturbance thus loss of topsoil. However, the wetter and cooler environment in northeast North Dakota compared to rest of the State is a cause of concern for producers wanting to plant their crops as soon as possible in a short growing-season.

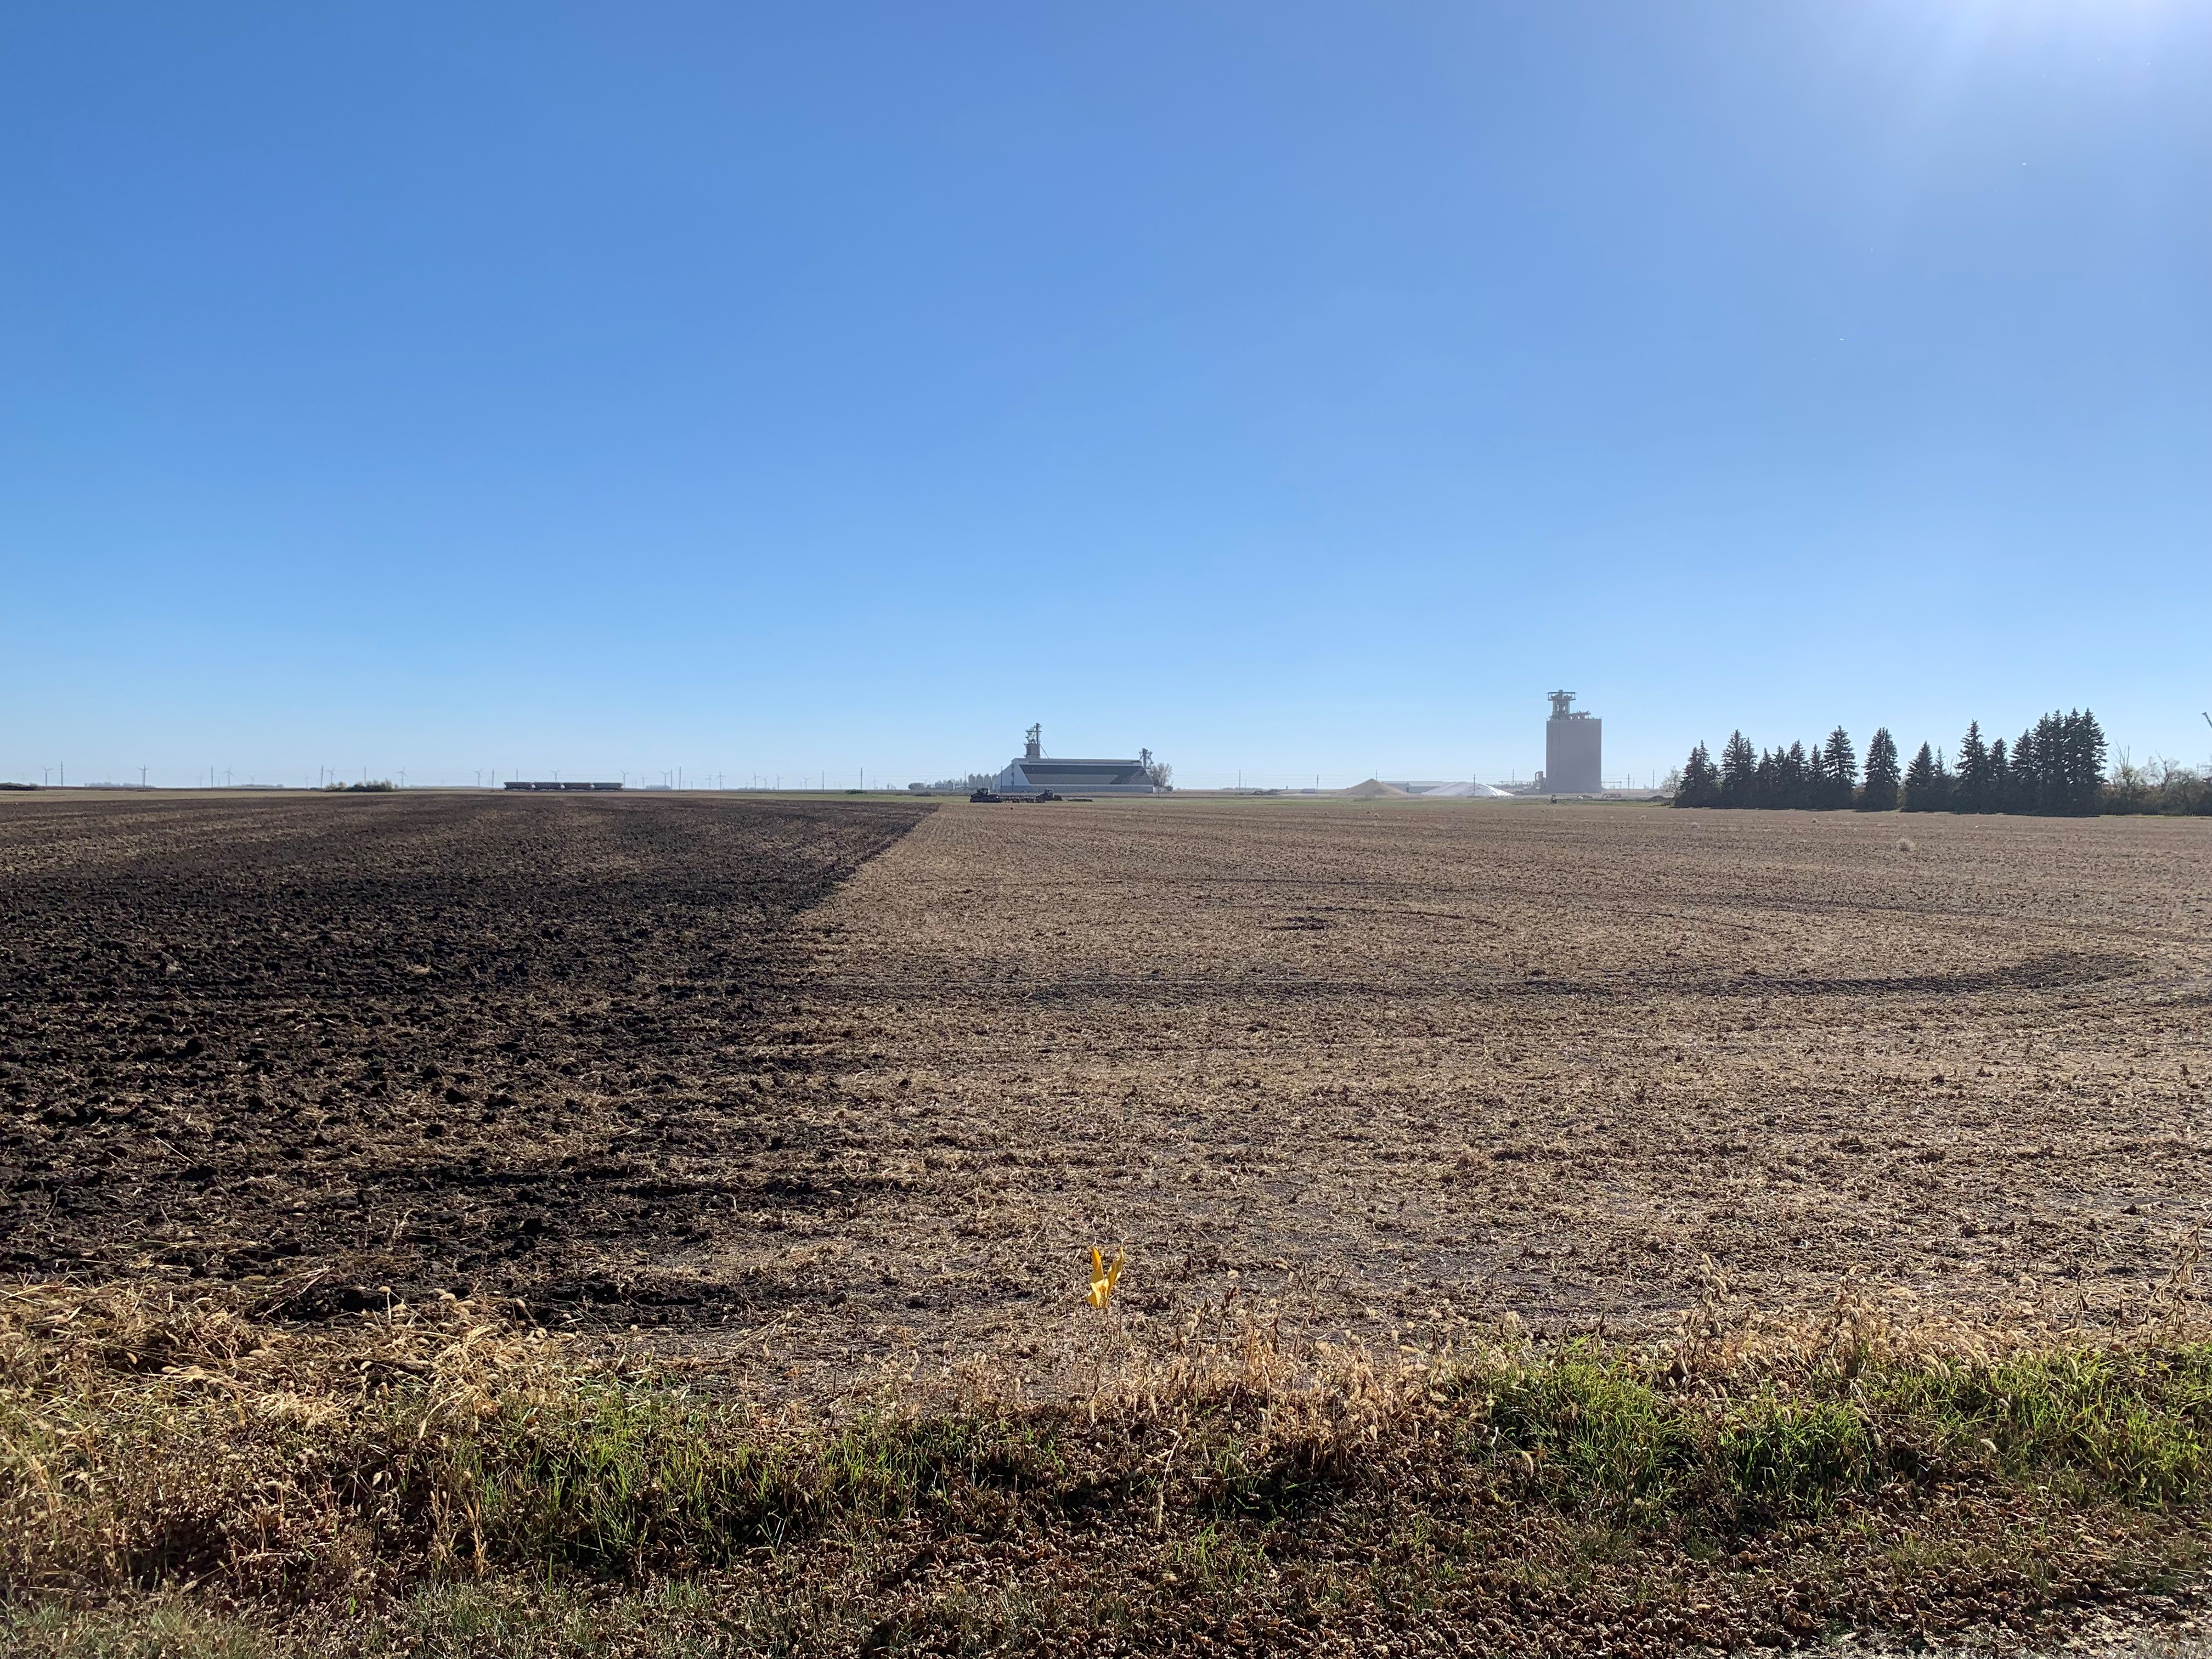
Considering the legitimate worries of the local producers, the NDSU Langdon Research Extension Center in Langdon, ND started a long-term (10-years or more) demonstration, which will compare the conventional-till versus no-till side-by-side in the northeast region. Unlike small plot research, this demonstration site includes big chunks of land that is very comparable to farmer fields.

Lead Author
Lead Author:
Naeem Kalwar
Other Authors

Travis Hakanson, Carmen Ewert

Availability
Availability:
Web only
Publication Sections
The Langdon Research Extension Center conventional-till versus no-till demonstration site on October 6, 2021.

Conventional tillage practices and the soil disturbance and loss they cause are well documented, especially in western North Dakota. Early adopters of no-till in western ND stopped using tillage for planting several decades ago. The main reasons were to conserve soil moisture and protect topsoil. However, in the northeast, producers mostly kept tilling their soils in fall and then again in spring. The common reason was and still is to dry the soils for timely planting as northeast ND has a slightly shorter growing-season compared to the other parts of the state. Recent wet weather cycle that started in 1993 also made switching to no-till difficult as producers became wary about wet field conditions in the spring resulting in late planting. A shorter growing season resulting in late planting can not only cause significant yield losses but there could be difficulties during harvest due to a wet-fall or early frost. Depending upon soil type and landscape and agronomic practices, it can take several years for the no-till practices to improve soil structure and water infiltration to help overcome challenges posed by a wet spring or fall. Several producers in the NE in the past tried no-till. Due to the wet weather, they faced numerous challenges such as muddy and saturated fields, cooler soil temperatures, poor seedbed, late planting, soil crusting, poor germination and stands during spring and muddy fields during harvest in the fall. Most of them gave up no-till and went back to conventional-till.

If we compare the weather and accumulated growing degree days of major crops grown around Langdon (NE) versus other parts of the state, Langdon weather is slightly cooler and wet. It has the lowest number of accumulated growing degree days for growing most crops.

For comprehensive comparisons, weather data from the Langdon North Dakota Agricultural Weather Network (NDAWN) station was compared with the stations in Carrington, Dickinson, Fargo, Hettinger, Minot and Williston (Figure 2 and 3). Based on the 2018-2022 average data (Figure 2), Langdon area had the lowest average maximum temperature versus all other NDAWN stations. In terms of lowest average minimum temperatures, only the Hettinger station recorded slightly lower temperature versus Langdon (42.60° versus 43.00°). For average rainfall during 2018-2022, the Langdon area received more rain than Minot and Williston.

Figure 2. Average maximum and minimum temperatures (°F) and total rainfall (inches) from April 1 to October 31 for 2018-2022.

Chart displaying average maximum and minimum temperatures (°F) and total rainfall (inches) from April 1 to October 31 for 2018-2022.

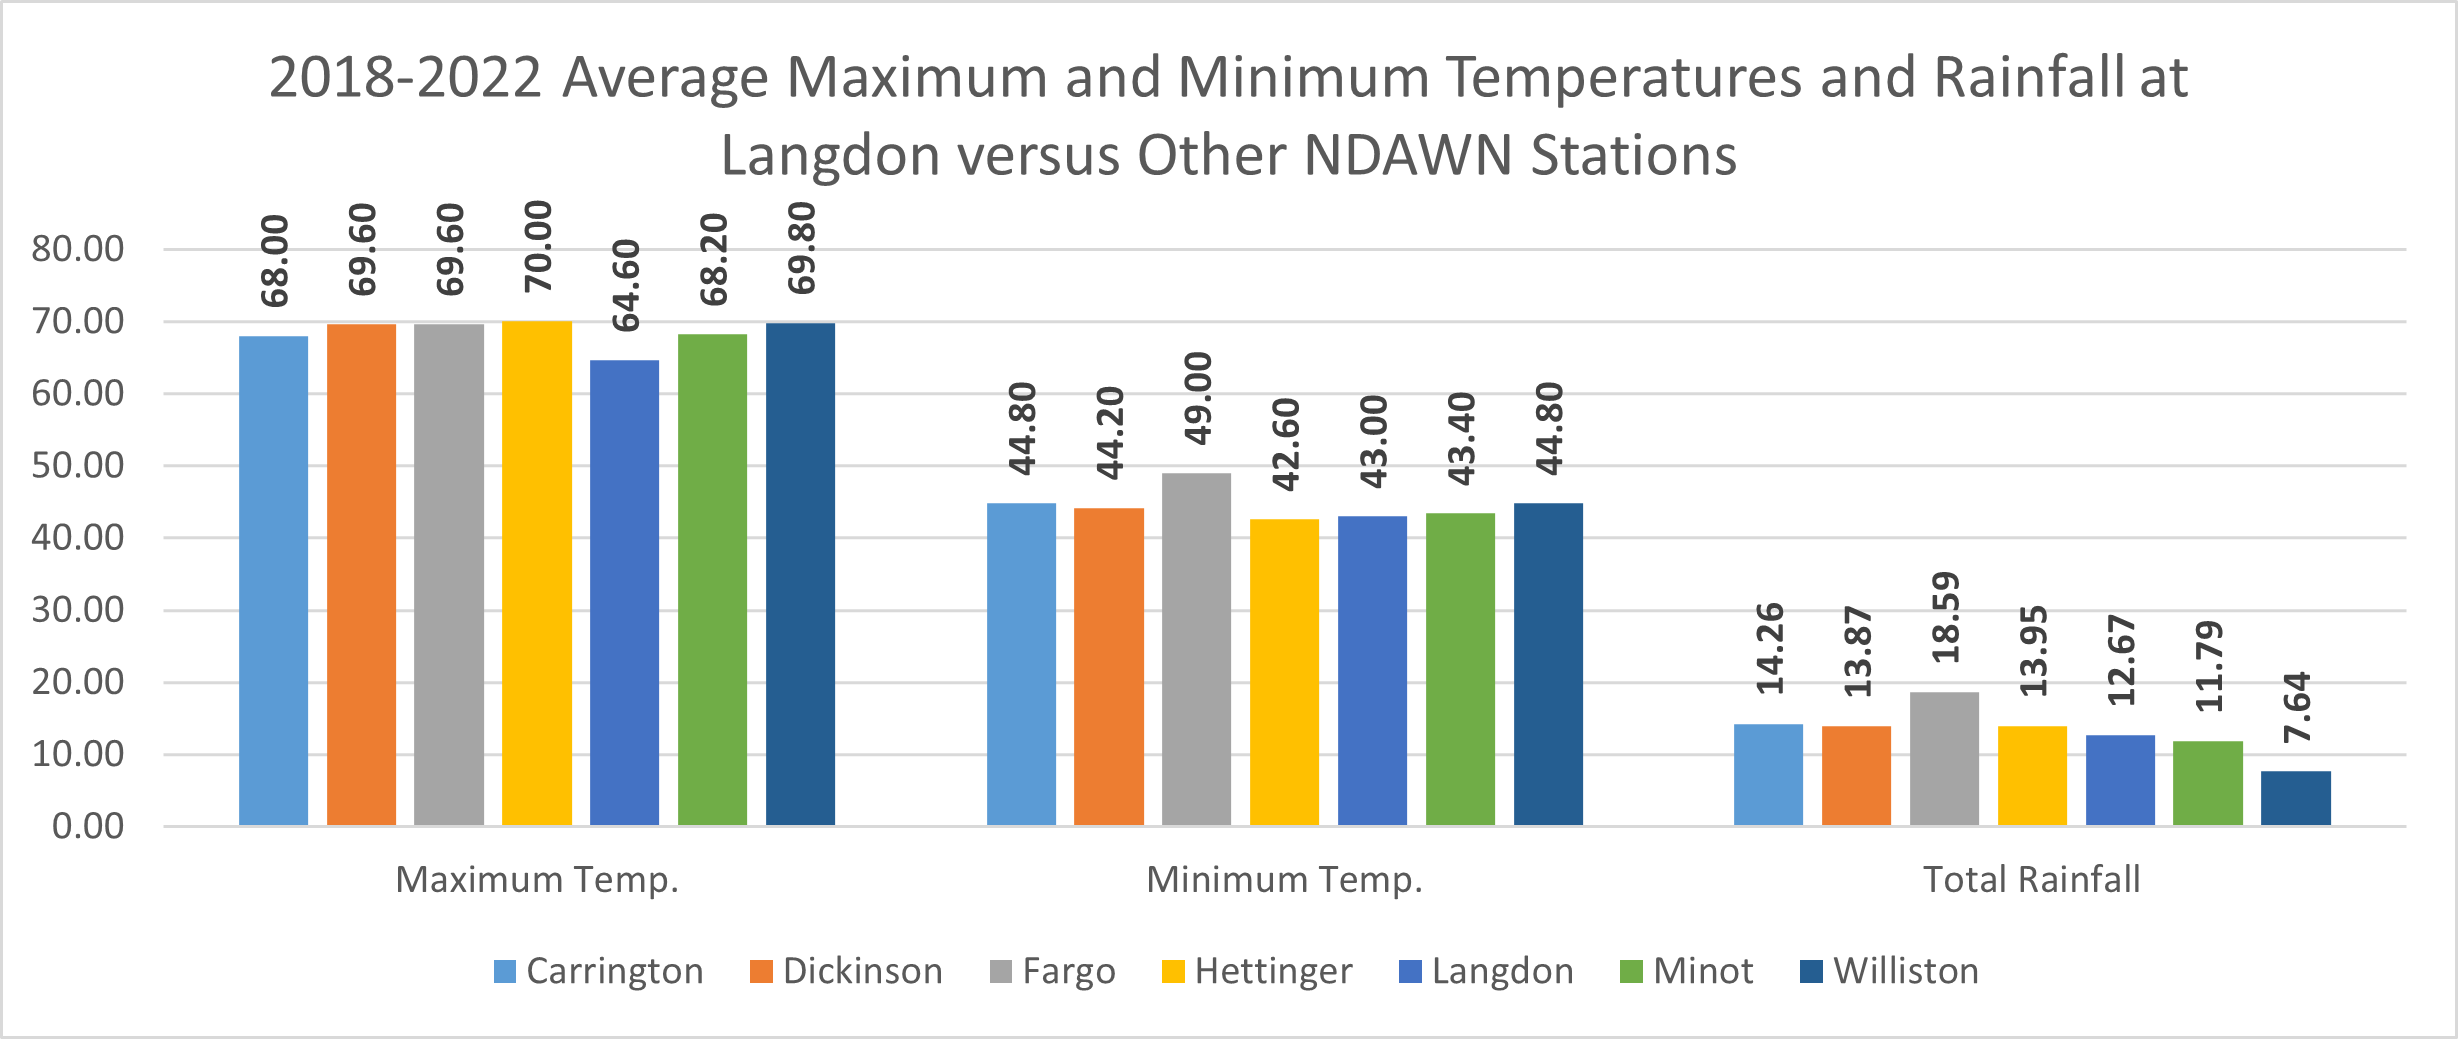
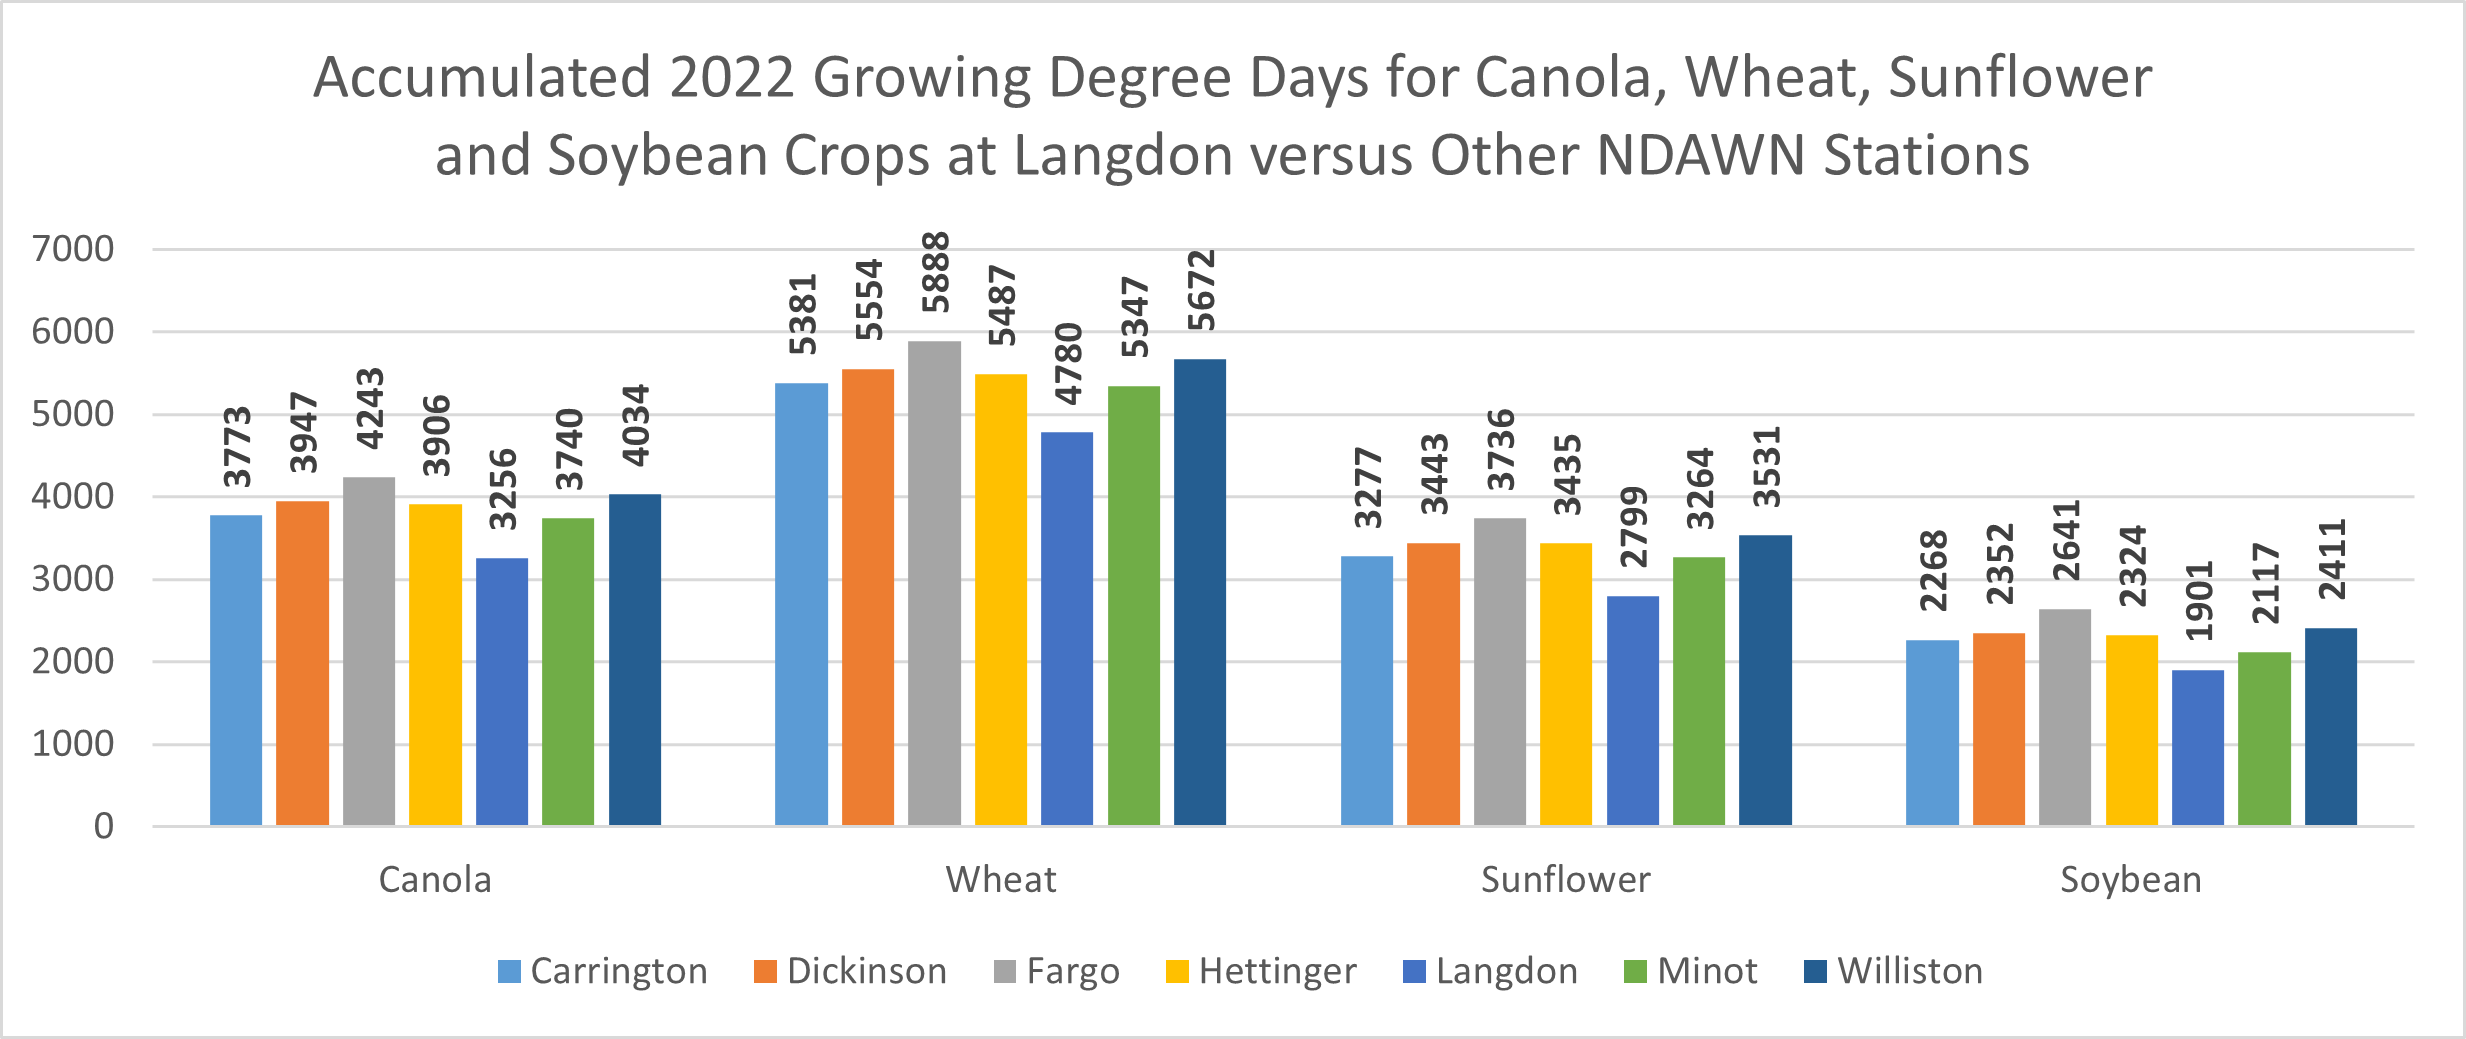
Figure 3 shows the NDAWN Station accumulated growing degree days for growing canola, wheat, sunflower and soybean around Carrington, Dickinson, Fargo, Hettinger, Langdon, Minot and Williston in 2022. The selected dates for canola, wheat and sunflower are from April 1 to October 31. For soybean, accumulated growing degree days are shown at 00.1 relative humidity. The starting time period for all stations is April 1, but the times for the end of the growing season are slightly different. For the Minot station, it is October 3, for Carrington, Hettinger and Langdon it is October 6 and for Dickinson, Fargo and Williston stations, it is October 7.

Figure 3. 2022 accumulated growing degree days for canola, wheat, sunflower and soybean at Langdon and other NDAWN Stations.

Chart displaying 2022 accumulated growing degree days for canola, wheat, sunflower and soybean at Langdon and other NDAWN Stations.

Based on the data in Figure 3, Langdon area had the lowest number of accumulated growing degree days for growing canola, wheat, sunflower and soybean versus the rest of the NDAWN stations in 2022. Given the benefits of no-till and the differences in Langdon area weather versus the rest of the state, a ten-year field scale conventional-till versus no-till demonstration was initiated in the fall of 2021 at the NDSU Langdon Research Extension Center in Langdon, ND. The plan is to keep everything the same except the differences in tillage practices.    

Objectives

Short-term objectives of this study are, how early each field can be planted, differences in the input costs, germination, stands and yields. Long-term objectives include effects on soil erosion, aggregation, structure, pore space and water infiltration (movement through soil layers).

Site Distribution and Details

An approximately 35-acre field was divided into two from north to south to create conventional-till and no-till sites. The no-till site is on the west and measured around 13.74 acres. The conventional-till site is on the east and measured 20.67 acres. There was a 15-feet border between them. Both sites included productive, marginal and unproductive areas in order to be truly representative of the farmer fields.

Field Work Details

Fall-2021

  • After harvesting soybeans, the conventional-till site was chiseled once on October 6. The no-till site was left as is.
  • Separate composite four-foot deep soil samples for 0-12”, 12-24”, 24-36” and 36-48” depths were taken from conventional-till productive ground (CT-PG), conventional-till unproductive ground (CT-UG), no-till productive ground (NT-PG) and no-till unproductive ground (NT-UG) for textural and chemical analysis.
  • Separate soil bulk density samples were taken from CT-PG, CT-UG, NT-PG and NT-UG for 0-5” and 5-10” depths.
  • Soil water infiltration rates were measured on CT-PG, CT-UG, NT-PG and NT-UG sites by simulating one inch of rain followed by the second inch.

Spring-2022

  • On the conventional-till site, a uniform rate of 125 pounds of N through Urea per acre was spread on May 29 followed by one-pass of a cultivator for incorporation. Then Fargo and Treflon (PPI) were sprayed on June 6 followed by two-passes of a cultivator. On June 7, Prosper (HRSW) was planted at the seeding rate of 1.66 bushels per acre.
  • No-till site was planted with Prosper (HRSW) on the afternoon of June 13 using the John Deere 1895 disc no-till drill. Seeding rate was 1.66 bushels per acre. Due to the issue of the no-till drill not able to flow high fertilizer rates, only 62.5 pounds per acre of N (135.86 pounds of Urea per acre) was applied at the time of planting. The rest of the 62.5 pounds of N per acre was top dressed later in order to make no-till fertilizer rate comparable to the conventional-till site. No-till site was sprayed with Roundup PowerMax 3 at 20 ounces per acre with Kicker (active ingredient ammonium sulfate) mixed in at 2.5 gallons of Kicker per 100 gallons of water (0.27 gallons of Kicker per acre).

Fall-2022

  • Conventional-till site was disked once on October 5.
  • Separate composite four-foot deep soil samples for 0-12”, 12-24”, 24-36” and 36-48” depths were taken from conventional-till productive ground (CT-PG), conventional-till unproductive ground (CT-UG), no-till productive ground (NT-PG) and no-till unproductive ground (NT-UG) for chemical analysis.
  • Separate soil bulk density samples were taken from CT-PG, CT-UG, NT-PG and NT-UG for 0-5” and 5-10” depths.
  • Soil water infiltration rates were measured on CT-PG, CT-UG, NT-PG and NT-UG sites by simulating one inch of rain followed by the second inch.

Soil Water Infiltration

Soil water infiltration rates were measured by pounding a six-inch diameter ring into the surface soil. After the ring was in place, 444 ml of deionized water was used to simulate one inch of rain. Once there was no standing water while soil was still saturated, second inch of rain was simulated by pouring 444 ml of additional deionized water. Both simulations were timed for water absorption into the soil.  The fall-2021 infiltration rates are in Table 1. There were a few key observations based on fall-2021 soil water infiltration rates

  • Soil water infiltration rates of conventional-till productive and unproductive grounds were much faster than the no-till productive and unproductive grounds.
  • On the no-till site, water infiltration was much faster on productive ground versus unproductive ground. That was mainly an effect of higher sodicity level, which caused soil dispersion resulting in dense soil layers.

Table 1. Soil water infiltration rates of conventional-till and no-till in fall-2021.

Site

Time for infiltrating First-inch

Time for infiltrating Second-inch

Fall-2021

Conventionally-Tilled Productive Ground

(CT-PG)

53.18 seconds

3 minutes and 3.29 seconds

Conventionally-Tilled Unproductive Ground (CT-UG)

36.45 seconds

3 minutes and 33.87 seconds

No-Tilled Productive Ground (NT-PG)

2 minutes and 5.74 seconds

8 minutes and 21.19 seconds

No-Tilled Unproductive Ground (NT-UG)

23 minutes and 1.88 seconds

1 hour, 16 minutes and 20.97 seconds

Soil Analysis Results

Based on the 2021 soil analysis results, conventional-till productive ground had low levels of salinity and no issue of sodicity in the 0-12 inch depth. The levels of salinity were high with moderately high sodicity in the same depth of unproductive ground. In the no-till area, salinity level was moderately high with very low sodicity in the 0-12 inch depth of productive ground. In the unproductive area of no-till, salinity and sodicity levels were very high in the 0-12 inch soil depth. Details are in Table 2.

Soil nitrogen (N) and phosphorous (P) levels in the unproductive areas of conventional-till and no-till were very high and high compared to the productive areas of both sites (Table 2). These results are quite representative of the saline and sodic areas versus areas that do not have these issues as there are hardly any plants growing on saline and sodic areas to take up nutrients from the soil.

Table 2. The 2021 soil EC, SAR, pH, N, P and K results of the conventional-till and no-till productive and unproductive areas for 0-12, 12-24, 24-36 and 36-48 inch soil depths.


Depth

EC

SAR

pH

NO3-N

P

K

O.M.

Sample ID

(inches)

(dS/m)


(lbs./ac.)

(ppm)

(ppm)

(%)

Conventional-till Productive Ground

0-12

2.44

2.06

7.60

16.0

5.0

190

3.20

12-24

4.90

3.99

7.76

6.0

3.0

130

1.50

24-36

5.25

5.89

7.77

8.0

2.0

180

1.00

36-48

2.09

7.67

7.86

10.0

3.0

280

1.10

Conventional-till Unproductive Ground

0-12

10.43

10.88

7.65

66.0

10.0

180

5.20

12-24

11.28

11.27

7.51

74.0

6.0

105

4.50

24-36

10.39

11.36

7.3

32.0

4.0

125

2.10

36-48

8.47

10.19

7.28

20.0

3.0

205

1.60

No-till Productive Ground

0-12

4.18

4.45

7.35

6.0

13.0

170

4.40

12-24

7.10

10.74

7.82

4.0

2.0

100

3.10

24-36

8.16

18.11

7.92

2.0

2.0

200

1.20

36-48

8.19

17.47

7.87

4.0

1.0

195

0.80

No-till Unproductive Ground

0-12

13.52

24.15

7.77

52.0

16.0

120

4.70

12-24

13.34

23.02

7.87

24.0

2.0

110

2.40

24-36

11.82

23.50

7.85

32.0

2.0

100

1.20

36-48

10.86

18.14

7.76

28.0

2.0

140

0.80

Harvest Details

  • Both conventional-till and no-till sites were swathed on September 19 and combined on September 28.

Key Takeaways Based on Year One

  • The conventional-till productive ground site appeared ready for planting at the surface four to five days earlier than the no-till productive ground.
  • The conventional-till productive ground site was wet right underneath the tillage depth compared to the no-till productive ground site. That resulted in marginal seedbed, uneven germination and stand.
  • The no-till unproductive ground looked much better and ready for planting compared to conventional-till unproductive ground. That indicates tillage may be less forgiving on areas with high salinity and sodicity levels.
  • Once ready for planting, the no-till productive ground site had a better seedbed, even germination and uniform stands.
  • Conventional-till unproductive ground had spotty germination and stand, whereas, no-till unproductive ground had zero germination and remained barren. That could be due to the higher salinity and sodicity levels in no-till unproductive ground site compared to conventional-till unproductive ground site.
  • Despite planted six days later, the no-till productive site caught up in growth and maturity with the conventional-till productive site.
  • Both sites were swathed on September 19 and combined on September 28.
  • No-till site yielded three bushels per acre more than the conventional-till site.